Dashboard


For this assignment, I used the Medicare government website to compare data from two hospitals in Arizona State, that is, Abrazo Arrowhead Hospital and Banner Baywood Hospital.
Additionally, the data was compared against the average of all hospitals in the country.
For the purpose of comparison of the two healthcare facilities, I looked at the amount of payment for various conditions and the value of care.
I then constructed a dashboard containing two graphs as show above to represent the information from the two hospitals. The graphs also include information from the national average on both the payment amount and the value of care. The information was adapted on 21st June 2021.
Importance of AHIM Coding to HIM a services and Managers
Managers benefit significantly through the recorded data. For instance, the can make timely decisions, identify gaps in performance, secure their organization’s data among others.
Importance of AHIM to Other Stakeholders
Constant recording of data promote accuracy and timely decisions.
Also, the government can track the progress of a disease through the data, for instance, Covid-19.

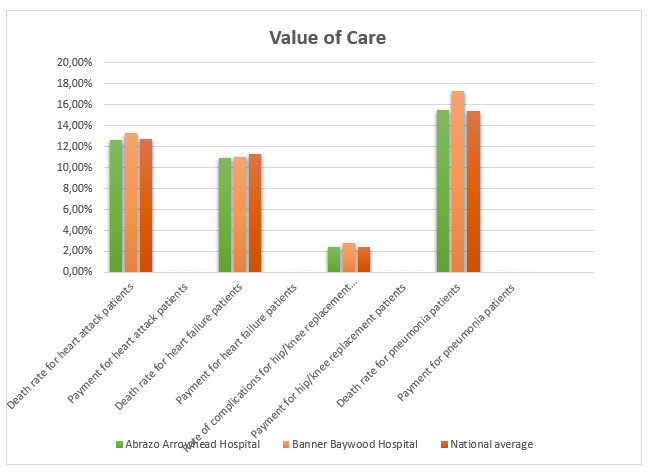
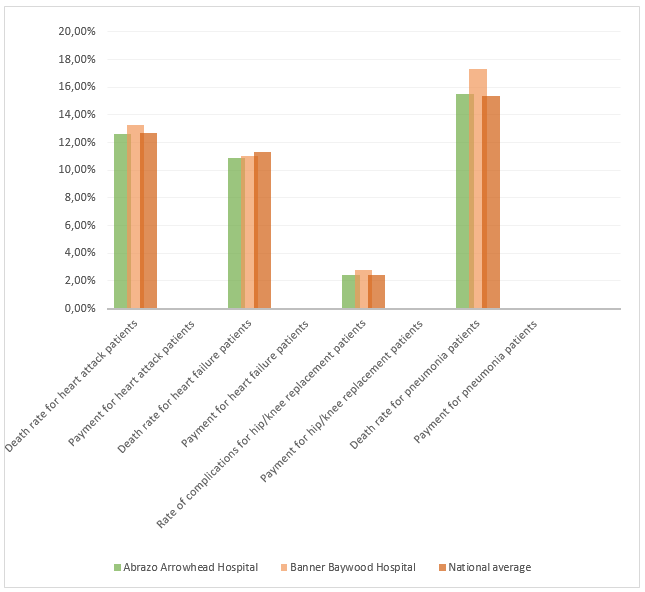
The above graph displays the value of care provided by two Arizona state hospitals, Abrazo Arrowhead Hospital and Banner Baywood Hospital, and a national average in various conditions.
The conditions compared in the visualization are heart attack, heart failure, complications for hip/knee replacement, and the death rate for pneumonia patients.
Banner Baywood hospital seems to be offering better value of care for heart attack patients than Abrazo Arrowhead Hospital and is slightlyt higher than the national average. The national average for heart attack patients value of care is at 12.7%.
Moreover, the national average value of care patients who have died from heart failure is at 11.30%. Also, Banner Baywood perfoms better than Abrazo Arrowhead Hospital.
The value of care of complications arising form hip/knee replacement seems to be very low as the national average is at 2.4%
The average value of care for patients who died from pneumonia is at 15.4%.
In all the conditions featured in the comparison, Banner Baywood Hospital seems to be better than Abrazo Arrowhead Hospital and slightly higher than the national average.

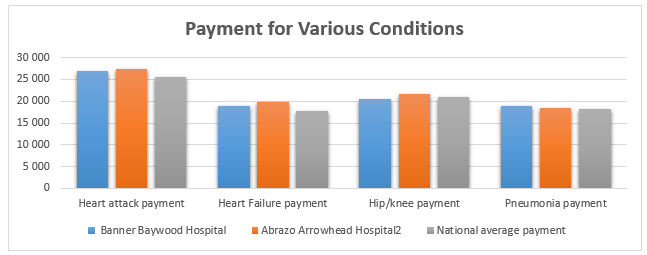
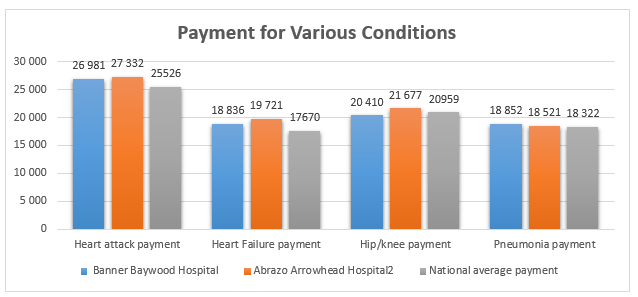
The graph above is a representation of a comparison of the amount paid to two hospitals, Abrazo Arrowhead Hospital and Banner Baywood Hospital, and national average payment.
The graph features payments for heart attack, heart failure, hip/knee complications, and pneumonia.
The first bar compares amount paid to treat heart attack patients in the three categories where Abrazo Arrowhead Hospital has the highest cost. However, Banner Baywood hospital is slightly above the national average amount.
The second bar represents the amount paid by patients suffering or who died from heart failure. Abrazo Arrowhead Hospital is still higher than the other two comparison.
The amount paid for hip/knee payment for complications is slightly higher than amount paid for heart failure. However, Abrazo Arrowhead Hospital is still leading with the highest amount paid.
The last bar represents the amount paid by pneumonia patients from the two countries and the national average. The amount from the two facilities have a slight difference from the amount paid on average nationally.
From the above data, I conclude that Abrazo Arrowhead Hospital services are slightly expensive than services from Banner Baywood Hospital and other hospitals nationally.
Importance of Payment and Value of Care Data
The data provides the managers with deeper insights into various conditions as compared to other facilities pointing out the areas that need improvement.
The amount paid for a service is crucial in consumer buying behaviour, hence, important in the planning of a health care’s financial strategies.
The Use of Benchmarking and Comparative Data
Managers use performance matrix and compare them to a standard set data and other organizations in the same industry.
Additionally, a healthcare facility can offer improved services to achieve customer satisfaction using improved processes fetched from benchmarking (McLinton et al., 2018).
Oragnizations that encourage comparison of data and benchmarking create a competitive environment providing opportunities for growth.
Predictions and Assumptions about the Data
Banner Baywood Hospital is likely to attract more customers than Abrazo Arrowhead Hospital as customers compare the price and value of services when making a decision to buy.
Nonetheless, the data from two organizations closely relate to the national average, hence, represent all hospitals in the country.
Evaluating the Report

The graph below shows results of a descriptive analysis, the mean and variance of the results of the comparison of the payment data.
The mean shows the amount that a patient would require on average to be treated for a particular disease.
On the other hand, the variance describes how far the amount of treatment is from each other.
From the analysis, payment for heart attack patients pay the highest amount on average at $26613, while pneumonia patients pay the least at $18565.
Therefore if a patient raised $26613, they could easily find a hospital to treat heart attack.
On the other hand, payment for patients who served heart failure has the highest variance while those the payment for pneumonia has the least variance.
In conclusion, different hospitals have very diverse amount of payment for heart failure while the prices for pneumonia are almost similar in most hospitals.
Descriptive analysis helps to explain distinctive characteristics of data and it crucial features (Lawless and Heyman, 2010).
In the table above, I have calculated the mean value for the amount of money paid for treatment of various conditions and the mean for the value of care for the conditions.
The analysis does not involve comparison of a single health care facility, rather, it analysis the healthcare system in Arizona state as a whole.
The table displays that treatment for heart attack is most expensive in all healthcare facilities while treatment for pneumonia is the cheapest.
On the other hand, pneumonia patients receive the best care while patients with hip/knee replacement complications receive the least care.
From the analysis, I conclude that price of treatment is not directly proportional to the value of care provided in Arizona state hospitals.
Justification of the Data
The mean of the payment for heart attack patients is highest while it does not display the best value of care.
Pneumonia patients have an advantage of cheap cost of treatment and best value of treatment.
However, there is a huge gap in the value of treatment for the patients having hip/knee replacement complications in Arizona.
Using Data for Decision-making
Data analysis provides a basis for good decision-making processes.
Through comparison of different amounts paid for various conditions, an organization may seek the most appropriate amount to charge.
Comparison of data also encourage the competitive spirit in an organization.
References
Lawless, H. T., & Heymann, H. (2010). Descriptive analysis. In Sensory evaluation of food (pp. 227-257). Springer.
McLinton, S. S., Loh, M. Y., Dollard, M. F., Tuckey, M. M., Idris, M. A., & Morton, S. (2018). Benchmarking working conditions for health and safety in the frontline healthcare industry: Perspectives from Australia and Malaysia. Journal of Advanced Nursing, 74(8), 1851-1862.