Abstract
Few studies have investigated the relationship between empowered leadership practices and job satisfaction among employees in the tourism and hospitality industry. Therefore, a gap in the literature exists because there is minimal understanding regarding the qualities that an empowered leader should have to increase job satisfaction in the sector. This study aims to understand the correlation between empowering leadership practices on job satisfaction among employees in the above-mentioned industry. Data used in this study was obtained using survey questionnaires, which were sent out to 60 employees working for ten hotels in three German cities. This information was analyzed using the Statistical Packages for the Social Sciences (SPSS) technique. The results confirmed three hypotheses proposed in the study, which predicted a positive correlation between leadership by example, participative decision-making, and enhanced social interactions among team members.
Introduction
Background to the Study
Increased competition in the tourism and hospitality industry has seen several organizations undertake structural changes to improve their market appeal. These alterations have been characterized by a paradigm shift in leadership that promotes flexibility and efficiency in leadership (Zheng et al., 2020). The change can be traced to human resource management literature, which encourages organizations to rethink techniques and strategies they use to motivate their employees by considering the adoption of employee-centered employee management practices (Srivastava & Pathak, 2020). This strategy inspires a new era of managerial policy research that highlights the importance of centering business operations around employee interests.
The transition from a rigid to flexible leadership structure to accommodate employee views has led to the development of empowered leadership as a concept in business management. It is primarily preoccupied with the distribution of power from a top-down leadership framework to a bottom-up one (Zheng et al., 2020). In other words, it promotes the inclusion of employee interests in organizational decision-making processes. Human Resource Management (HRM) literature supports empowerment as a core principle of leadership by asserting that it is the foundation for developing quality customer services and organizational performance (Srivastava & Pathak, 2020). Consequently, empowerment is integrated into contemporary literature.
As its name suggests, empowered leadership involves giving employees the authority to make decisions the same way a Chief Executive Officer (CEO) would do in an organizational setting. This means that employees will exercise executive influence at a high level of decision-making (Zheng et al., 2020). In the context of this study, empowerment is the process of delegating decision-making authority from an exclusive club of managers to lower-level employees. It serves as the foundation for adopting democratic leadership practices, which are focused on promoting principles of shared leadership (Srivastava & Pathak, 2020). Thus, the empowered leadership approach allows employees to be semi-autonomous and work effectively, whether organized in teams or individual group settings (Sanchez-Manzanares et al., 2020). The inclusion of employees in decision-making complements their role in supporting business operations by upgrading their status from mere workers to organizational functionaries. This transition is at the center of the initiative to embrace empowering leadership practices in organizational development (Willis, 2019). This is because empowered teams are now performing most of the tasks undertaken by traditional leaders, such as directing and controlling group activities.
The concept of empowered leadership is part of a wider body of literature underpinning 21st-century changes in business practices. In the past, scholarly literature on leadership was mainly concerned with accumulating power and authority to accomplish organizational goals (Srivastava & Pathak, 2020). However, the kind of leadership practices promoted in contemporary society leans more towards coaching than directing – as was the case in the past. Indeed, companies today are less willing to “boss” their employees around, choosing instead to engage with them at a respectful level (Sanchez-Manzanares et al., 2020). This change in approach is supported by scholarly literature suggesting that employee engagement and collaboration strategies are more effective at improving productivity than a “carrot and stick” approach pegged on motivating employees through rewards and gifts (Sanchez-Manzanares et al., 2020). In this regard, empowered leadership gives employees more control over their work and accords them with improved opportunities for engaging in various aspects of business development.
The successes of employee empowerment platforms in developed countries seem to have sparked a growing interest in the concept in emerging markets. Notably, the concept’s success in several Asian nations, including Japan, means that it has immense potential to be adopted in countries that share similar cultures or have a non-western view on leadership and empowerment. Relative to this observation, Eseryel et al. (2021) highlight the importance of empowering employees to make decisions in their work contexts. They say a belief in this system would allow leaders to exercise resilience and self-control in managing organizational affairs (Eseryel et al., 2021). Stemming from this relationship, organizations that adopt the empowered leadership style benefit from improved levels of job satisfaction because employees will feel appreciated when management considers their views in decision-making.
Employee empowerment also benefits employees through improved self-esteem, development of better risk calculations, achievement of a better work-life balance, and enabling them to harness efforts to achieve common goals, just to mention a few (Willis, 2019). By developing these unique capabilities, it is plausible to say when employees feel they are in control, they are likely to improve their productivity, knowing that they have a firmer understanding of the processes involved in production. Based on this understanding, the effect of empowerment on employer-employee relationships is often reciprocal because managers benefit from improved levels of trust. At the same time, employees enjoy the benefits of enhanced self-assessment and career growth opportunities through empowerment. Relative to this statement, Walker (2016) says employees are more likely to trust leaders who empower their subordinates than those who do not do the same.
Similarly, in a team setting, empowered employees work more diligently than their disgruntled counterparts. At the same time, research studies reveal that empowered employees are more innovative and creative in accomplishing their organizational tasks than those not equipped with the same capabilities (Zheng et al., 2020). This benefit could stem from the heightened levels of flexibility associated with the empowered leadership doctrine. These insights show that empowerment is a win-win strategy for both employers and employees.
Job satisfaction is another variable mentioned in this study as a measure of employee contentment with work. Ilyas et al. (2021) define job satisfaction as a “pleasurable state” when one’s accomplishments are noticed and appreciated. At the center of these feelings of satisfaction is congruence between one’s needs and values espoused at work. There is a correlation between people’s expectations about a job or assignment and their actual experiences at work. The congruence mentioned above suffices when there is a minimal gap between employees’ expectations and expertise. Subject to this definition, Heimerl et al. (2020) take a more pragmatic definition of job satisfaction by saying it is a sense of gratification that people derive from their work. Although some studies have linked it with money or financial compensation, the concept is more profound than that, in the sense that it denotes someone’s happiness, which emerges when they are satisfied with their work.
Based on the insights highlighted above, various factors could influence job satisfaction. Pay and benefits emerge at the top of these factors, but the work environment also affects employee job satisfaction, and it can be traced to conditional attributes associated with performance (Ilyas et al., 2021). Depending on the job or task involved, the interests generated by an office, including its possible benefits, could also influence job satisfaction levels. In this regard, the concept provides a firm ground for establishing an organization’s operational culture and systems (Negi & Dangwal, 2019). Heimerl et al. (2020) contribute to this discussion by saying that most employees who exhibit low levels of job satisfaction are likely to show similarly low levels of motivation and poor quality outputs. Some studies further link these employees with high worker absenteeism and employee turnover (Negi & Dangwal, 2019; Heimerl et al., 2020). Comparatively, the same articles indicate that satisfied employees are cooperative and motivated to work (Negi & Dangwal, 2019; Heimerl et al., 2020). Broadly, the concepts of job satisfaction and empowered leadership are critical to the present investigation because of the need to understand the correlation between empowered leadership on employees’ job satisfaction in the tourism sector.
Research Problem
The tourism and hospitality industry is one sector where leadership plays a vital role in improving organizational performance. This is because the industry is a service-oriented industry whose success depends on the quality of services and products offered by staff (Zhao & Li, 2018). Poor leadership practices would cause employees to be demoralized, thereby undermining service delivery and the overall performance of the organization. Similarly, good leadership practices are likely to inspire employees to improve their performance. It is assumed that they are likely to replicate the same spirit in their service delivery efforts, thereby improving customer satisfaction and organizational performance standards in the process (Zhao & Li, 2018). Leadership plays a crucial role in influencing organizational performance within the tourism and hospitality industry. Relative to this assertion, Gardner (2018) says that employee productivity is maximized when an enriching environment is supported by effective leadership.
The vulnerability of the tourism and hospitality industry to the effects of poor or good leadership practices stems from the interpersonal nature of services offered at hotels and similar facilities. In other words, it is difficult to imitate the services provided by service providers in the sector because each one of them has “a unique touch” that appeals to their target customers. This statement could explain why some hotel clients have preferences on whom to serve them. Therefore, substitute products and services in the tourism and hospitality industry make it difficult for customers to remain loyal to a business that does not cater to its unique needs (Walker, 2016). Additionally, hotels and similar establishments in the tourism and hospitality sector are sensitive to the negative publicity created by scandals or the publication of poor business practices. Collectively, these factors highlight the sensitivity of the industry to good and bad leadership.
Given that job satisfaction levels are a function of an organization’s leadership practices, it is crucial to understand the correlation between empowering leadership practices on employees’ job satisfaction levels in the tourism sector. The industry’s sensitivity to the vulgarities of leadership makes it relevant to understanding the role that employees and leaders play in completing organizational tasks. The present study aims to understand the correlation between empowered leadership practices on job satisfaction levels in the tourism and hospitality industry. In the context of this study, leaders will be identified as managers who are not part of teams but are expected to provide leadership to their members. The findings of the investigation will provide an empirical basis for understanding the nature of relationship between empowerment and overall organizational performance in the hospitality and tourism sector.
Research Gap
Despite the increased appreciation of empowering leadership practices in the management of teams, there is little empirical evidence highlighting the qualities that an empowered leader should have to enhance satisfaction in the tourism and hospitality industry. Notably, the industry’s peculiarities, such as high employee turnover, overrepresentation of a young workforce, and the instability of jobs, have not been compared against the ongoing push to empower employees to work independently. Figure 1.1 below shows that the tourism industry is among the industries with the highest employee turnover rate.
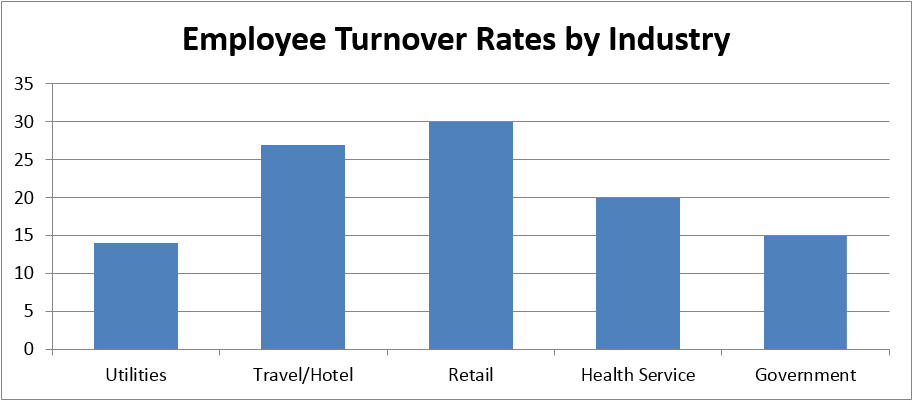
The statistics highlighted above show that the travel and hotel sector is only second to the retail industry in terms of employee turnover. The utility sector and government had the lowest rates of employee turnover, meaning that they provided grounds for developing a stable career. However, the multiplicity of factors affecting the performance of the industry has made some careers, such as those in the travel and hotel industry, become less stable. Additionally, being a service-centered industry, the absence of strategies for implementing empowering leadership practices makes it difficult for hotels and other organizations within the tourism and hospitality field to adapt favorably to changing market conditions.
To fill this existing research gap, the researcher will test three hypotheses in the current study. The first one is the existence of a positive relationship between leadership by example and job satisfaction. The second one is the existence of a similarly positive relationship between participative decision-making and job satisfaction, while the last one argues for the presence of a positive correlation between enhanced social interactions among team members and job satisfaction.
Relevance of Study
Leadership plays a vital role in the success of any organization or institution. As highlighted in this study, it refers to the act of influencing people to follow a shared vision by inspiring them to be the best version of themselves (Kaya & Karatepe, 2020). The relationship between leadership and employee satisfaction will form the basis for undertaking this study. The investigation findings could help enhance empowering leadership programs in various organizations operating in the tourism and hospitality industry. This is because some leaders do not understand the critical role they play in facilitating organizational change. Therefore, the present study highlights the importance of good leadership practices in fulfilling organizational goals to improve employee satisfaction.
The ongoing COVID-19 pandemic also heightens the relevance of this study to the contemporary business and working environment because it has caused changes in workplace dynamics. They have affected how employers and employees relate and the power dynamics that underpin their relationship. The shift towards remote working instead of making physical work trips to the office highlights the importance of empowered leadership practices in the contemporary business environment. Employees need to be empowered to work effectively and remotely. Given that analysts expect this trend to outlive the pandemic (Sigala, 2021), it will be vital to identify attributes that support empowered leadership practices in the modern business environment, primarily related to employee job satisfaction levels. This analysis will be crucial in helping managers to lead teams effectively in the contemporary organizational setting. Indeed, by identifying skills that are integral in leading empowered teams, organizations will be better adapted to the changing market dynamics of the global tourism and hospitality industry.
Structure of Paper
This paper is divided into five essential parts. The first one is the introduction section, which provides a background to the study and gives the general direction that the investigation will follow. The second section is the literature review segment, which contains an analysis of scholarly literature on the subject area. It also includes a definition of critical concepts and terms that are pertinent to the current investigation. The third part is the methodology chapter, which outlines the steps and procedures followed by the researcher in testing the hypotheses underpinning this investigation. The justification for selecting the quantitative inquiry as the primary data collection and analysis format will also be provided in this research segment. The findings derived from applying the above methodological approaches will be highlighted in the fourth section of the document. This part also explains deviations, or congruencies of results, based on the data and existing literature analysis. The analysis section will be used as a foundation for developing the last segment of the study, which is the discussion section. It contains a summary of key findings and recommendations for future research.
State of Research and Hypotheses
State of Research
This section of the study contains an analysis of the current state of research on leadership empowerment and job satisfaction in the tourism and hospitality industry. Key issues highlighted in this section of the analysis include characteristics of empowered leadership, differences between empowered and traditional leadership, the relationship between empowered and traditional leadership, differences in performance before and after empowerment, and the historical roots of empowerment. At the end of the investigation, three research hypotheses will be formulated.
Historical Roots of Empowerment
Employee empowerment is an old concept that first gained traction in management literature in the mid-1990s (Kaya & Karatepe, 2020). Other historical accounts of the concept traced its origin to the 1950s and 1960,s when researchers probed workers’ motivation and sensitivity to environmental stimuli (Willis, 2019). Employee involvement schemes of the 1970s were also part of the history of empowerment literature. Since the 1980s, the role of empowerment in boosting organizational performance has been seen as a management tool (Kaya & Karatepe, 2020). Market-based changes in various economic sectors have supported this evolution of empowerment literature.
While developing the concept of empowerment in HRM literature and its subsequent integration in organizational culture practices (Negi & Dangwal, 2019), few researchers presented it as a form of leadership theory. However, recent developments and applications of the concept in contemporary management fields suggest a leadership theory for HRM. It is premised on the need for leaders to recognize change and work with others to navigate challenges that come along the way. This application of empowerment leadership theory is a departure from the days or the works of philosophers, such as Plato and Aristotle, who provided some of the earliest foundations of leadership theory (Negi & Dangwal, 2019). Their contributions have replaced a subtler form of leadership built around a leadership philosophy defined by power-sharing arrangements, team-building structures, and trust. Within the empowered leadership setting, an organization’s vision gravitates to creating or protecting common values with a customer-centric focus. The standard set of values creates a unity of purpose for achieving organizational success, while the customer-centric approach improves productivity and profitability for other shareholders. Therefore, both employers and employees gain from the relationship.
Differences between Empowered and Traditional Leadership Structures
Literature is abundant regarding the relationship between leadership practices and job satisfaction levels in the tourism and hospitality industry. However, this level of interrogation is not evident in empowered leadership forums, which are structurally different from traditional leadership practices (Arnold et al., 2000). The main point of difference is the structure and processes adopted in organizations when implementing leadership formats. The traditional model of leadership is defined by a strict hierarchical and centralized system of control whereby a few individuals within the organizational setting make decisions and their recommendations percolate down to other levels of management. The organizational structures of such companies provide a framework for implementing these decisions, with lower-level employees lacking the foresight or insight needed to understand processes or decisions involved in developing the actions they are told to implement (Kaya & Karatepe, 2020). In this organizational setting, roles and functions of leaders and workers are defined, with possibilities of role overlaps significantly minimized due to the presence of strict controls (Arnold et al., 2000). The traditional leadership setting adopts a leadership philosophy that allows employees to take pride in implementing what leaders want. At the same time, managers must develop structures or programs that keep employees subservient to this objective. This traditional organizational structure has been used to manage organizations since the early years of developing corporate literature.
As highlighted in chapter one of this report, changes in the business environment, which improvements in product quality have occasioned uncertainties on economic recovery, technological development, and changing consumer tastes and preferences, have seen companies change or remodel their business activities to improve efficiency and cut costs (Negi & Dangwal, 2019; Heimerl et al., 2020). This plan has seen several of them eliminate layers of management and elevate employee contribution to enhance performance (Kelly & Nicholson, 2021). Similarly, there has been a reduction in the number of employees in various organizations and a change in management philosophy, which has seen teams develop a greater level of resiliency in completing their tasks (Negi & Dangwal, 2019; Heimerl et al., 2020). They have also assumed leadership responsibilities that were once the preserve of managers in line with the empowered leadership format.
At the center of these changes is the emerging concept of empowerment, which is predicated on creating an enabling environment for employees to thrive by eliminating variables that cause dissatisfaction and elevating those that make positive feelings of acceptance and growth. In most organizations, these empowered employees operate in teams, drawing attention to the need to understand the dynamics of their operations, particularly from a leadership perspective (Negi & Dangwal, 2019; Heimerl et al., 2020). These discussions have led to the development of unique engagement requirements for leaders and employees designed to foster increased satisfaction levels.
Empowered teams are different from other groups of employees because they often operate independently and are self-directed. This statement means that they have more autonomy over their work than other teams in an organization. Some of the privileges that these teams enjoy, over others that have similar structures, include the ability to schedule tasks, organize vacations, and recommend the recruitment or dismissal of group members (Knežević et al., 2021). Managers have been forced to adopt a new attitude when interacting with such teams because, unlike in the past, when their roles were limited to directing group activities, they are often required to undertake a self-assessment report (Knežević et al., 2021). It aims to understand how they can use their skills to equally empower teams and make sure they perform optimally, despite limited management intervention. In line with this role, managers may be required to exhibit model behaviors for other team members to emulate. At the same time, they must possess new skills such as empathy and emotional intelligence when managing issues affecting employees (Knežević et al., 2021). Overall, changes in the roles and responsibilities of managers and employees in the empowered leadership setting also require a new paradigm shift in leadership management.
Qualities of an Empowered Leader
Leading by Example
In a traditional leadership format, leading by example refers to the commitment of a leader to direct team members on how best to accomplish their goals. In the contemporary business environment, leaders who lead by example often work harder than others or have a strong work ethic (Arnold et al., 2000). The commitment that leading by example demonstrates to team members is shared to believe that they can solve leadership problems. In this context of modern leadership, a leader is expected to help others lead themselves by demonstrating how this may be done or achieved through exemplary leadership (Arnold et al., 2000). Based on this statement, the main difference between an empowered leader and a traditional leader is that the latter has control over team members. In contrast, the empowered team structure gives employees control over their actions. Subject to these insights, most attributes associated with empowered leadership structures may differ from those evident in traditional leadership settings.
Participative Decision-Making
Participative decision-making is another quality of an empowered leader. Researchers, such as Arnold et al. (2000) and Knežević et al. (2021), have highlighted its role in boosting employee morale. They suggest that empowered leaders integrate the views and opinions of team members in their decision-making processes (Arnold et al., 2000; Knežević et al., 2021). Therefore, measuring the extent or quality of participative decision-making is predicated on the need to understand how leaders are willing to encourage team members to participate in group tasks or decision-making processes.
Different organizations have adopted unique ways of implementing participative decision-making, with some embracing formal communication structures, while others prefer informal communication platforms (Knežević et al., 2021). Additionally, the degree of participation could vary and be measured percentage-wise, like 0-100%. The degree of variation could be explained by several theories explaining employee motivation, such as Abraham’s Maslow Hierarchy of Needs, which highlights the need for employees to feel motivated to perform their tasks well. Supported by substitute theories, extensive literature shows the benefits of including employees in decision-making processes (Kunneman et al., 2019). Their findings show that this process helps to boost employee morale and commitment. By extension, organizational productivity is enhanced, but the best effects are seen in service-oriented organizations (Kunneman et al., 2019). Customer-centered organizations have also reported similar positive results; however, the best ones have been observed when employees are free to share ideas and skills, enhancing organizational learning processes (O’Reilly Media, 2020). According to figure 2.1 below, the features mentioned above of participative leadership interact with various other perceptive factors, such as self and collective effectiveness, to increase productivity.
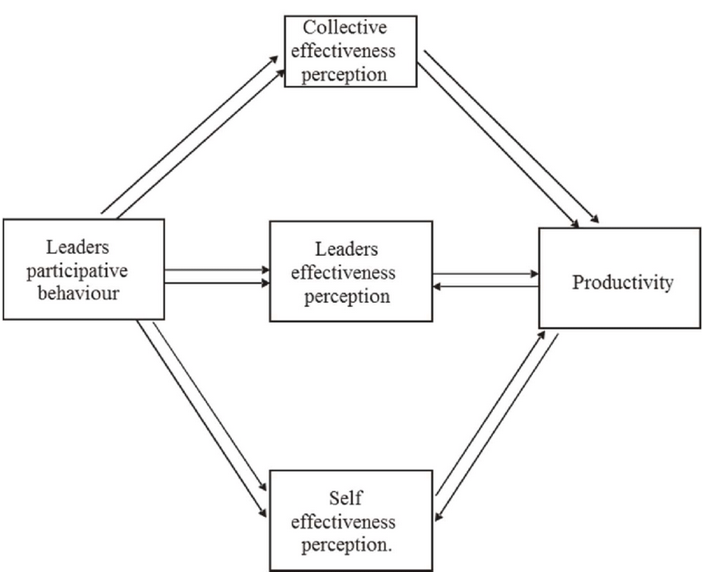
In the above matrix, participative leadership is defined by the freedom to share ideas through self and collective perception and by the adoption of various practices, such as open and transparent communication, respect for diversity, and the development of cooperative relationships, to promote group cohesion. In line with this statement, Or and Berkovich (2021) view participative decision-making processes as an employee management tool, allowing staff to create an environment that enables them to work productively and efficiently for the benefit of their customers. Kunneman et al. (2019) agree with this statement by arguing that empowerment is a form of control mechanism that links pay with performance.
The participative decision-making approach has been linked with increased incidences of co-participation in decision-making processes and improved working conditions (Arnold et al., 2000; Knežević et al., 2021). This type of leadership approach is also more effective in situations or industries involving many players. Often, managers who operate in such an environment may find it challenging to include the views of all stakeholders in decision-making processes. However, the participative component of leadership makes it possible to integrate different stakeholders’ insights into one strategy action. From the perspective of preserving employee-employer relationships, both parties could benefit from improved loyalty and commitment to making joint decisions. In this analysis context, leaders benefit from enhanced employee buy-in, and employees enjoy high levels of trust. Overall, leaders who demonstrate strong participative decision-making skills encourage team members to participate in group activities and keep them engaged.
Showing Concern and Interacting with Team Members
Another leadership attribute associated with empowered teams involves showing concern and interacting with team members. Leaders who have this attribute often demonstrate a general concern for the well-being of their associates (Arnold et al., 2000). By doing so, they treat each team member with respect and would often convene meetings that discuss how to improve the welfare of members. At the interaction phase, leaders of empowered teams are likely to possess skills that allow members to interact seamlessly with one another. The same leaders may want to know team dynamics and work closely with members to achieve common objectives (Arnold et al., 2000). Broadly, the three leadership qualities in an empowered team setting highlighted above share similarities with those mentioned in traditional leadership literature, such as coaching, training, and communication.
According to Willis (2019), empowerment can only work when employers and employees are ready to change their behaviors or practices. At both ends of the interests represented by both parties, concessions may be made in the power dynamics underpinning employer-employee relationships whereby the contribution of each party is acknowledged and appreciated. For example, employers need to appreciate the role played by employees in boosting organizational productivity and understand that empowering them is not an affront to their power but a clever way of improving organizational productivity (Arnold et al., 2000). In this analysis, employers and employees are invited to work together to achieve a common objective in their lives. However, for the best results to be realized, there needs to be trust between employers and employees, guaranteeing that they will maximize each other’s best interests.
In line with this goal, empowered leadership demands that managers pay close attention to creating autonomy and feedback mechanisms where self-directed teams could be nurtured and trained to succeed. Particularly, the concept of autonomy is highlighted in these discussions because it denotes the ability or power of employees to come up with unique solutions for managing their problems (Arnold et al., 2000). The feedback loops highlighted above provide a platform for practicing self-learning and self-directed behavior, which works by using employee data to make improvements or changes that would better enhance performance. However, to optimize results, managers need to be trained on best practices and provided with sufficient tools for exploiting the opportunities created through team empowerment.
The Relationship between Empowering Leadership Practices and Job Satisfaction among Employees
Extant management literature suggests that empowered leadership shares a close relationship with job satisfaction standards (Willis, 2019; Kaya & Karatepe, 2020). This is because the existing scholarly literature on human resource management suggests that job satisfaction should always be pursued (Negi & Dangwal, 2019). The justification for making this statement is rooted in the understanding that increased levels of job satisfaction create conditions necessary for the realization of improved product and service quality. This outcome is beneficial to both employers and customers because the latter enjoy improved services while the former benefits from enhanced productivity. Subject to these value transfers, managers are often encouraged to pursue policies that enhance employee commitment through improved levels of job satisfaction (Kaya & Karatepe, 2020). However, employee empowerment initiatives adopted by several organizations are designed to encourage staff to be more contented and satisfied with their work. This goal is desirable because studies suggest that high levels of empowerment are associated with a high degree of control for job tasks and improved performance levels for an organization (Willis, 2019; Kaya & Karatepe, 2020). The popularity of these employee empowerment initiatives stems from the relationship between employee empowerment initiatives, commitment, and job satisfaction.
The link tying the three attributes mentioned above of performance is further enhanced by the presence of measurement surveys, such as the Workplace Employee Relations Survey, which connects employee empowerment initiatives, commitment, and job satisfaction to create a holistic understanding of the relationship between empowering leadership practices and job satisfaction among employees (Arnold et al., 2000). Therefore, it is essential for management to challenge their employees to take less familiar roles in preparation for future tasks where management involvement will be further lessened. Thus, the relationship between empowered leadership practices and job satisfaction among employees is supported by the presence of a challenging work environment that would allow employees to test their leadership skills.
The above-mentioned objective aligns with the primary goal of embracing employee empowerment initiatives to mitigate the effects of the changing business environment on employee motivation, morale, and job satisfaction standards. Scholarly research has highlighted quality circles and team networking services as possible organizational activities that empowered leadership practices will improve employee and organizational outcomes (Arnold et al., 2000). These sentiments are closely intertwined with corporate culture because it describes the foundation for influencing employee attitudes and norms (Negi & Dangwal, 2019). A quest to create flatter organizational structures through de-layering processes is at the center of the changes highlighted above, which have ushered in the era of empowered leadership.
Differences in Work Productivity before and After Empowerment
Organizations have reported positive and negative results from leadership empowerment initiatives (Kelly & Nicholson, 2021). Those with positive results have reported improved levels of innovation and creativity among employees, while others have mentioned an increase in productivity (Willis, 2019; Kaya & Karatepe, 2020). Firms that have reported a negative result after empowerment have unchanged or low employee productivity and morale levels. The blame has been attributed to management incompetence, especially in the area of employee training. Kelly and Nicholson (2021) support this argument by saying that employees, who are supposed to exercise delegated decision-making authority, need proper training to manage this new responsibility. The failure to give them this type of support is akin to setting them up for failure. Organizations that have registered negative results in terms of empowerment leadership often neglect this important fact (Willis, 2019; Kaya & Karatepe, 2020). Therefore, employee training could create significant differences in work productivity before and after empowerment.
Empowered leadership could cause the above-mentioned positive and negative outcomes on organizations because of its effects on employees’ self-esteem. Gardner (2018) draws attention to this fact by saying that empowered leadership helps to bring out employee strengths and weaknesses. Without the support highlighted above, employees are likely to fail in their empowerment programs because they would lack the skills of self-direction needed to secure the success of empowered teams. However, positive results are often realized when employees are prepared and resourced to manage the power and commitment required to make self-directed teams work. If done correctly, they will have an enhanced belief in their self-efficacy standards. Therefore, organizations play a pivotal role in either helping people improve their self-efficacy levels or creating self-doubt, which may be detrimental to an organization’s future. Empowerment teams, which suffer this type of outcome, are likely to have a weakened belief in themselves and their sense of power within the more comprehensive organizational dynamic power structure.
In the above assessment, the results after empowerment are defined by the role of participant management structures in nurturing employer-employee relationships. They also highlight the interplay that employers and employees engage in within the organizational setting, where formal and informal engagement processes are pursued in their goal-setting processes (Willis, 2019; Kaya & Karatepe, 2020). The relationship has also been observed when both parties formulate a reward system based on performance or competence. Finding the right balance for team members involved in empowered leadership would enhance an employee’s level of self-entitlement.
The negative empowerment outcomes defined above are partly attributed to poor communication networks between employers and employees and the presence of an environment supporting rigid bureaucracies, which impede idea flow and interpersonal engagements, thereby diminishing the power of empowered leadership (Walker, 2016). The presence of an authoritarian leadership style and job characteristics are additional attributes relating to empowerment leadership that create a sense of helplessness among employees. It is important to overcome these limitations to realize the benefits of empowered leadership.
Research Questions and Hypotheses
To recap, this study aims to understand the relationship between empowered leadership practices and job satisfaction among employees in the tourism and hospitality industry. The research question and hypotheses are highlighted below.
Research Question
What is the nature of the relationship between empowered leadership and employees’ job satisfaction in the tourism and hospitality industry?
Research Hypotheses
Three research hypotheses will be investigated in this study. They are listed below:
- H1: Leading by example has a positive correlation with job satisfaction
- H2: Team interaction has a positive correlation with job satisfaction
- H3: Participative decision-making has a positive correlation with job satisfaction
The three hypotheses described above provide the outline for the development of an overall research framework for this study, which is characterized by the transcendence of leadership empowerment competencies into high levels of job satisfaction. Therefore, leadership empowerment is fundamental in achieving a heightened level of job satisfaction in an industry. Hypothesis 1 (H1) above predicts that employers’ inputs is positively correlated with job satisfaction through exemplary leadership. Using the research framework outlined above, this effect is felt through employee empowerment practices, such as creating a positive environment for team interaction. The second hypothesis (H2) predicts that team interaction is positively correlated with job satisfaction. Alternatively, the third hypothesis (H3) claims that participative leadership is positively correlated with job satisfaction. These hypotheses will be tested in subsequent sections of this study.
Methods
This section of the study highlights techniques and procedures used by the researcher to carry out the investigation. Key sections of the analysis explain important details relating to the techniques adopted by the researcher from the initial point of the research, which is selecting respondents, to the final stage of the research process that is analyzing their views. They also explain the research approach, design, and type characterizing the current research to understand the conceptual foundations of the study. Additional details relating to measurement instruments used in developing the questionnaire and the purpose of the study are also detailed in this section.
Sample
The purpose of the present study is to understand the nature of the relationship between leadership empowerment practices and employee satisfaction standards in the tourism and hospitality industry. Kundu et al., (2019) define such empowerment practices as those involving power-sharing agreements and resource allocation processes linking companies and their employees. To understand the nature of correlation between empowered leadership on job satisfaction levels, respondents were required to give demographic data to understand their backgrounds. This provision of the data analysis process appeared in part 1 of the survey questionnaire, which was designed to collect demographic data about the informants, including their age, education qualifications, gender, employment type, positions in organizations, and marital status. In the end, the goal of collecting this data was to determine whether these demographic variables affected respondents’ views, or not.
The second part of the questionnaire sought to sample their views about leadership and management practices in their organizations by categorizing data into three distinct subcategories of leadership – individual, participative, and team-based practices. The data collection process involved discussions with 60 respondents who provided diverse views regarding the leadership practiced in 10 German hotels where they worked. This number of respondents was adequate to cover the study’s goals because of resource limitations on the part of the researcher. Additionally, the multiple numbers of employees who came from different hotels improved the diversity of responses provided by the informants, thereby strengthening the reliability and credibility of the findings.
Research Design/ Approach
The researcher used the quantitative research design in the study by obtaining the respondents’ views in a statistical format. The technique works by sampling respondents’ views using numerical indices – denoting a specific level of emotional agreement or disagreement with a research issue (Enns et al., 2017). The questionnaires were issued to respondents using the snowball sampling method and to members of a focus group discussion. The snowball sampling method works by identifying one respondent who gives consent to take part in a study (Audemard, 2020). Later, he or she introduces a researcher to a group of other participants willing to take part in the study (Audemard, 2020). The researcher adopted the same pattern of employee engagement in the current investigation. An initial contact introduced the investigator to a group of other employees who were equally willing to take part in the study. The initial contact was an acquaintance of the researcher, but the rest of the informants were recruited through the snowball sampling method. This sampling strategy was used in all the hotels whose employees took part in the study.
Research Type and Purpose
As highlighted above, the quantitative research design was used in the present study to answer the research questions. The adoption of this technique means that the data obtained was saved in a statistical format (Audemard, 2020). The investigator used the quantitative research method to undertake the present study because the original intention of the research was to analyze the problem by quantifying it using numerical data. This technique allowed the researcher to quantify the attitudes of employees towards leadership effectiveness using measurable indicators of opinions and behaviors (Sablan, 2019). Therefore, the researcher gathered data from a small sample of employees and used the information obtained to generalize it to a larger population. The quantitative nature of this research was replicated in the research questionnaire, highlighted in appendix 1, where data was collected using five measurable indicators of employee feelings/sentiments. The questionnaire design was formatted to collect quantitative information with responses categorized into measurable units discussed in subsequent sections of this chapter.
Properties of Data
It is important to understand the characteristics of the data obtained in the study to comprehend how the researcher categorized the findings into distinct variables that helped answer the research questions. Given that the present investigation focused on empowered leadership practices as one of the main variables in the study, the research borrowed from existing literature to define this variable. Consequently, the classification criterion adopted by Arnold et al. (2000) outlined the main data properties to look out for. They described five factors relevant to understanding leadership behaviors, and they included “coaching, informing, leading by example, showing concern when interacting with team members, and participative decision-making” (Arnold et al., 2000, p. 249). These variables helped to identify the main qualities of empowered leadership practices that were instrumental in shaping employee job satisfaction levels. The consistency of the data obtained was guaranteed by the compatibility of data from different sets of respondents.
Time of Measurement
The measurement of time for the proposed study involved a selection between cross-sectional and longitudinal time-series analyses. Cross-sectional data are retrieved from the process of obtaining information through multiple sources and within one specific period (Enns et al., 2017). Comparatively, the longitudinal time series analysis involves collecting the same information at different points in time (Enns et al., 2017). Therefore, researchers who use this type of technique may gather the views of one group of respondents at different points in time. Comparatively, the cross-sectional research approach only analyzes the views of such informants at one point in time and the findings developed because of the experience accrued (Enns et al., 2017). Based on these definitions, strengths, and weaknesses of both techniques of data collection, the cross-sectional time-series plan was best suited to the needs of the present investigation because data were collected from multiple respondents at one specific time. The main justification for using this technique is its ability to help researchers affirm or disapprove of assumptions.
Measurement Instruments
The researcher used different techniques for quantifying the main research variables in the paper. In this section of the chapter, details relating to sources of measurement instrument, sample items, description of scale, and Cronbach Alpha will be described.
Source of Measurement Instrument: As highlighted in this study, the researcher gathered data from the respondents using quantitative questionnaires. They were semi-structured, in the sense that part of their design involved the integration of open and closed-ended questions. The open-ended questions gave respondents the freedom to answer them in whichever manner they wished. However, the closed-ended questions had formatted responses, which required the participants to react to statements based on five levels of attitudinal appeal – “always,” “often,” “sometimes,” “rarely,” and “never.” The five levels of analysis were drawn from the five-point Likert scale format, which measures respondents’ reactions towards leadership practices exuded by their employers.
The researcher based the items or statements posed in the questionnaire on the empowering leadership questionnaire (ELQ) Items defined by Arnold et al. (2000). The justification for using the ELQ was its widespread use in leadership assessment within the organizational context (Arnold et al., 2000). In other words, it advances a superior framework of measuring respondents’ views on leadership from one that focuses on generalized aspects of leadership to one that embodies the spirit of empowerment in the same pursuits. Adopting this technique helped to reduce the redundancy of line items in the questionnaire.
The extensive use of the ELQ questionnaire on several studies that have focused on leadership development means that the reliability of the ELQ items on the questionnaire was substantially high (Arnold et al., 2000). The ELQ items borrowed from the texts created a larger number of unique variances that enriched the information about leadership. For example, it helped the researcher to explore the concept of leading by example, as one of the main tenets of empowered leadership practices. The results suggest that organizations or employees whose leaders practiced ethical behaviors were likely to influence ethnic juniors to do the same (Willis, 2019; Kaya & Karatepe, 2020). This analysis means that most of the data collected from the respondents allowed the researcher to capture behaviors that would not have otherwise been observed in the traditional organizational setting.
Sample Items: Collectively, all the three main thematic areas of investigation highlighted in this study, including the ability to evaluate individual leadership capabilities, the ability to lead by example, and promoting teamwork, play a pivotal role in meeting the overarching goals of the study. Stated differently, they are aimed at understanding the correlation between empowering leadership practices and job satisfaction in the tourism sector.
The three thematic areas highlighted above collectively had 21 items on the questionnaire representing unique statements about leadership and management practices in various organizations. These three critical review areas had an uneven number of questions posed in the questionnaire to align with varying depths of information needed in the analysis. For example, the variable “teamwork” had the highest number of statements – seven items, while the one with the lowest number of items on the questionnaire was leadership management, and it had five items. Each of the sample items had unique identifiers for each question. For example, participative decision-making had six statements, represented by the item names P1 – P6. Similarly, leading by example had five statements, each represented with the item number L1-L5. Alternatively, ten statements, each with an identifier titled T1-T10, represented discussions about teamwork. These items are presented in the codebook attached herein as appendix 2.
Description of Scale: Leadership is often regarded as the subjective quality of organizational performance because it varies from one context to another. As a result, different scales of measurement have been proposed to measure leadership. For example, the Leadership Behavior Descriptive Questionnaire (LBDQ) is often used to measure leadership behaviors in the traditional organizational setting (Shermon, 2017). This measurement technique considers time and structure as the main building blocks of effective leadership. Therefore, it supports the development of a scenario where employee interests and organizational structures are synchronized to generate improved performance (Shermon, 2017). This measurement scale could not be used in the current investigation because it only partially captures leadership qualities evident in organizations with empowered teams. Particularly, it focuses on understanding how technical aspects of leadership behavior, such as organizational structure, influence employee performance (Shermon, 2017). This approach to data collection makes it less sensitive to capturing the zeal of organizations to adopt empowered leadership practices because it is based on the efficacy of peoples’ soft skills. Thus, it fails to capture the spectrum of leadership attributes applicable in an empowered team setting.
Cronbach Alpha: The Cronbach Alpha is a measure of internal consistency of variables used in this study to determine if the scales used in a study are reliable (Yildirim et al., 2019). In the context of this study, the Cronbach alpha method was used to determine if the multiple questions posed to the respondents could generate reliable data. The Cronbach alpha method was deployed to understand the effects that subtle aspects of employee behaviors or characteristics could influence performance (Yildirim et al., 2019). For example, it was used to observe hidden variables like a person’s willingness to answer questions and their level of consciousness in answering them. In this regard, the Cronbach Alpha method was used to determine how closely related the variables were if these effects were accounted for.
Using the SPSS technique, the Cronbach Alpha was used to measure the internal consistency of the scale items by performing factor analysis. This was done by determining the internal consistency of the questionnaire items representing each aspect of leadership empowerment. The total score of the correlations was also used to measure the Cronbach Alpha and it was determined that the Cronbach’s Alpha output was 0.839 for the total questionnaire. The items representing leadership by example had a total score of 0.833, while item values for participative leadership and interactions with team members being 0.842 and 0.837, respectively. These figures show that the items selected in the questionnaire had a score low than 0.839, except for participative leadership, which had a score of 0.842. Alternatively, the researcher conducted the test-retest reliability assessment and all the scores ranged from.99 to 1.0, which represents a strong measure of internal consistency of the variables used in the study. The goal was to ensure that all the mentioned items represented an accurate understanding of the leadership variables highlighted in the questionnaire. The five-factor model highlighted by Arnold et al. (2000) regarding the ELQ items affirmed the findings of this reliability test. It shows that the questionnaire was suitable for collecting data relating to the relationship between empowering leadership practices and job satisfaction.
Results
The section of the study relates to the findings obtained from applying the techniques of the study mentioned above. Information about gender, marital status, age, and education qualification will be qualified for the descriptive analysis and the relationship between variables explained using the regression analysis. To recap, the main aim of this study was to understand the relationship between empowered leadership practices and job satisfaction among employees in the tourism and hospitality industry. Again, the researcher was testing three hypotheses in the investigation, which predicted a positive relationship between leadership by example, participative decision-making, and enhanced social interactions among team members on job satisfaction. The section below presents the descriptive findings of the respondents’ demographic characteristics.
Descriptive Statistics
As highlighted in the methodology section of this paper, the researcher sampled the views of 60 respondents who served as hotel workers in various German cities. The descriptive analysis method, which was instituted using the SPSS method, focused on sampling their demographic characteristics, including gender, age, educational background, and marital status. These pieces of information characterized the first part of the survey questionnaire, which captured the respondents’ demographic characteristics and the findings are presented below.
Gender
The first demographic variable analyzed in this study was gender. Numbers 1, 2, and 3 were used to represent males, females, and “diverse” genders. According to table 4.1 below, there were 60 participants in the study; most of them were male (34 people), while females were 24. Both genders represented 56.7% and 40% of the total sample of the respondents, respectively. Only two respondents claimed to have a “diverse” gender, representing 3.3% of the total sample of informants who took part in the study. Table 4.1 shows the distribution of the respondents according to this variable.
Table 4.1: Classification of respondents according to gender
The distribution of respondents who took part in the investigation according to gender was captured in the study to determine whether this variable affected the respondents’ views. Consequently, the effects of gender on the three-factor items presented in the questionnaire were analyzed using the regression method. The three main variables depicting empowered leadership practices were represented in the table presented in appendix 2 with PT being participative leadership, IN highlighting concern for team members, and LD depicting leadership by example. As seen from the statistics above, gender did not significantly affect the findings because none of the variables mentioned above had a significance value higher than p>0.05, meaning that gender did not affect the respondents’ findings.
Age
Age was the second demographic variable investigated in the study. The respondents had five options to choose from with the first one being defined by an 18-25 year age group. The 26-35 year age group defined the second category, while the 36-45 age range defined the third one. The fourth age category was comprised of employees between the ages of 46-55, while an age group above 55 years described the last category. According to table 4.2 below, young respondents aged between 18 and 25 formed the most significant sample of respondents (60%), while those aged between 26 and 35 years formed the second smallest group of informants (23%). The group with the least respondents was made up of the 36-45 years age range, while those who were older than 46 years comprised 13.3% of the total sample. The findings are depicted in table 4.2 below.
Table 4.2: Classification of respondents according to age
The above findings suggest that most of the respondents who took part in the study were young people. This result is consistent with the high proportion of young workers in the tourism and hospitality industry (Eurostat, 2020). Therefore, the respondents’ ages are consistent with those of the majority of workers in the industry. According to the findings highlighted in appendix 3, the respondents’ age did not influence their views on the research topic. This is because none of the three variables identified above assessed (leadership by example, participative leadership, and showing concern for team members) had a significance value below p>0.05, which is the determining level for correlation.
Work Positions
Work positions were the third demographic variable highlighted in this investigation. The informants had six options to select from, and they included the positions of director, manager/supervisor, maintenance and cleaning staff, front-desk employees, restaurant staff, and “others.” Table 4.3 below highlights the distribution of the respondents according to these positions.
Table 4.3: Distribution of respondents according to work positions
According to the statistics highlighted above, most of the informants who took part in the study were maintenance and cleaning staff, followed by employees who worked in restaurants. The smallest group of participants comprised manager/supervisor positions, which had two and four respondents answering the research questions, respectively. Appendix 4 highlights the correlation of findings between the respondents’ work positions and their responses. According to the findings, the respondents’ work positions did not affect their views on the research topic because none of the ELQ factor items had a significance value below p>0.05. Consequently, it can be assumed that the age of the respondents did not influence their views.
Marital Status
The fourth demographic variable analyzed in the study was the marital status of the respondents. Informants were required to state whether they were single, married, divorced, widowed, or had an “expanded” arrangement. The findings revealed an almost near number of single and married participants who took part in the investigation. In detail, 26 respondents were single, while 24 of them were married. Both researchers represented 43.3% and 40% of the total sample, as shown in Table 4.4 below.
Table 4.4: Classification of respondents according to marital status
Education Qualifications
The education qualification of the respondents was the fifth demographic variable investigated in the study. Informants were allowed to state their highest level of education based on five key criteria outlined in table 4.5 below.
Table 4.5: Classification of respondents according to education qualifications
Based on the above findings, most of the respondents (50%) who took part in the study had high school qualifications. Those who held a diploma certificate formed the second largest group of participants (20%), while six had a “masters or higher” education qualification. Two participants had a bachelor’s degree certificate, while ten had a “primary school or lower” certification level. The effects of these education qualifications on the respondents’ views were analyzed, and the findings are highlighted in appendix 5.
Employment Type
The type of employment contract of the hotel staff who took part in the investigation helped the researcher evaluate its effects on the findings. Two categories were identified: full-time and part-time employees. Table 4.6 below highlights how the informants were distributed according to these two identifying criteria.
Table 4.6: Distribution of respondents according to employment type
According to table 4.6 above, 32 of the employees who participated in the study worked as full-time employees, while 28 of them served in part-time positions.
Results – 1st Hypothesis
Item Selection: Leading by Example
Leadership by example was one of the measures of empowerment highlighted in the study. It was also one of the variables of empowered leadership practices mentioned by Arnold et al. (2000) to affect the effectiveness of leadership and captured by the ELQ items. Therefore, it was used to assess whether the leadership practices employed by managers had a positive or negative correlation with job satisfaction. As highlighted in this study, leading by example, was one of the main variables in the current investigation. The first area of assessment results signifying the importance of leadership by example, as an antecedent of empowered leadership, was undertaken using descriptive statistics. By carrying out statistical tests using the SPSS technique, some of the data properties assessed in this analysis included the mean, median, standard of deviation, and variances. Five ELQ items were posed to the respondents to address “leadership by example” as an empowering quality, and the findings are highlighted in table 4.7 below.
Table 4.7: Hypothesis 1 Findings
Classification of Results
According to the findings highlighted in table 4.7 above, four of the ELQ items had a mean of between 1 and 2, which signifies a high approval rating for the leadership practices adopted in the organization. This statement means that the leaders working in their respective organizations positively influenced their juniors to be empowered by showing a good example of how employees should behave. It can be deduced that the strong sentiments of leaders in this area of performance inspired the respondents. Additionally, it can be assumed that the high rating reported in “leadership by example” signifies a high level of job satisfaction in the area of leadership empowerment, as indicated by the respondents. Therefore, this study’s first hypothesis (H1) is accepted because it predicted a positive correlation between “leadership by example” and job satisfaction. This finding means that leadership practices employed in the sector have improved employees’ level of job satisfaction.
Results – 2nd Hypothesis
Item Selection – Showing Concern and Interaction with Team Members
The second area of leadership empowerment investigated in the study related to the importance of leaders to show concern for the welfare of team members and the need to engage them in decision-making processes. Six ELQ items were linked to this area of assessment, and the collective views of the respondents are highlighted below. The second area of assessment results, signifying concern with team members, was analyzed using descriptive statistics. The review involved analyzing different properties of data, including mean, median, standard of deviation, and variances. These descriptive properties were used to assess the respondents’ reactions to the six ELQ items mentioned above, and Table 4.8 below contains the findings of the investigation.
Table 4.8: Hypothesis 2 Findings
Classification of Results
According to the abovementioned findings, the average mean of ELQ items relating to the importance of concern and interaction among team members was denoted by the value “1.” This outcome means that most of the respondents agreed with the statements posed in the questionnaires about their leaders exhibiting good social interaction skills and concern for team members. The response signifies a high level of job satisfaction among team members. It also means that this study’s second hypothesis (H2), which predicted that team interaction would have a positive correlation with job satisfaction, is accepted.
Results – 3rd Hypothesis
Item Selection: Participative Decision-Making
The third aspect of leadership empowerment explored in the investigation is related to participative decision-making. To recap, it refers to the willingness of leaders to encourage team members to contribute to decision-making processes and group activities. Given the broad nature of participation in leadership development, this area of investigation had the highest number of ELQ items – 10. Similar to the other two variables highlighted above, the analysis for participative decision-making was undertaken using descriptive statistics. The assessment reviews different data properties, including mean, median, standard of deviation, and variances. The descriptive data properties were used to analyze the respondents’ reactions to the ELQ items mentioned in Table 4.9 below, which contains a broader spectrum of the findings.
Table 4.9: Hypothesis 3 Findings
Classification of Results
According to the findings highlighted in table 4.9 above, the average mean of the responses was 2.3, meaning that the informants had a generally favorable view of participative leadership styles in their organizations. Stated differently, most of them believed that their leaders involved them in decision-making processes and the daily running of their organizations. It can be assumed that this sentiment signified their satisfaction in this area of leadership analysis. The findings mean that the third hypothesis (H3), which predicted the positive effects of participative decision-making on job satisfaction, is accepted. Nonetheless, the respondents’ views on this area of leadership were not as strong as the other two mentioned in this review – leadership by example and showing concern or interaction with group members. However, when analyzed collectively, the three areas of leadership assessment were largely representative of a positive correlation with job satisfaction.
Correlation between Variables
The researcher used Pearson’s correlation test to investigate the relationship between and within sets of variables and the findings are presented below.
Table 4.10: Correlation findings
The findings highlighted above suggest that leadership by example (LD), participative leadership (PT) practices, and concern for team members’ welfare (IN) were not correlated. For example, there was no correlation between concern for team members (IN) and leadership by example (LD) because the equation emerging from the two variables was as follows: r(60) = -02, p=.857. Similarly, the correlation between concern for team members (IN) and participative leadership practices (PT) was insignificant as seen in the equation: r(60) = -21, p=.100. In these instances, the correlation among the three variables were insignificant because they were higher than p>-0.05. These findings suggest that leaders could possess distinct qualities relating to empowerment and job satisfaction that do not have any relation with each other.
Discussion
Summary
The findings highlighted in this paper accept the three hypotheses guiding this paper. In other words, the employees were satisfied with the leadership practices adopted in their organizations based on how they related to team empowerment. To explain these findings, it is important to understand the role of industry-specific factors in explaining job satisfaction levels. Theoretical support for this discussion is rooted in human resource literature, which has explored the relationship between job satisfaction and leadership (Negi & Dangwal, 2019; Heimerl et al., 2020). For example, the works of Maslow’s hierarchy of needs and Herzberg’s hygiene theory are relevant to understanding why employees have a favorable view of the leadership practices employed by their superiors (Walker, 2016). Notably, Maslow’s hierarchy of needs theory helps to explain why employees approve of their leaders’ concern for their wellbeing. It states that employees are primarily guided by the need to satisfy their primary needs, including their housing, food, and clothing requirements before they strive to fulfill other higher needs (Walker, 2016). Therefore, leaders who recognize these hierarchies of needs and work in tandem with them are likely to realize the highest rates of job satisfaction. This statement is true because they would follow the order of needs satisfaction identified above, which is essential in understanding what makes employees happy. The Maslow hierarchy of needs theory was developed, among others, to explain factors influencing employee motivation.
Douglas McGregor also provides a foundation for understanding the findings presented in this report through his categorization of leadership theories. He says that the leadership practices representing modern and traditional styles of governance can be categorized as theory X and theory Y, which define authoritarian and less authoritarian leadership styles (Walker, 2016). In detail, theory X refers to authoritarian leadership styles, while theory Y assumes non-confrontational leadership techniques. The latter group of leadership styles has been instrumental in explaining empowerment leadership styles because they are more interactive than directional methods (Walker, 2016). Therefore, the dichotomy of theories above highlights differences between traditional and contemporary leadership styles, which have been used to assess the correlation between empowering leadership practices and job satisfaction. As highlighted in this study, contemporary leadership practices represent the theory Y version of leadership because they all strive to coach employees. Comparatively, theory X represents a traditional or authoritarian leadership style, which has been used to motivate employees (Walker, 2016). Therefore, the findings of this study represent theory Y outcomes, which denote the informants’ bias towards preferring non-confrontational leadership styles.
The findings highlighted in this document also suggest that the three hypotheses relating to “leadership by example,” participative decision-making, social concern, and interaction were accepted. This statement means that the findings highlighted in this study are consistent with the existing scholarly body of scholarly research, which has investigated the relationship between job satisfaction and leadership practices in HRM (Kaya & Karatepe, 2020). Therefore, it can be assumed that the effects of empowered leadership practices on employees are consistent with similar observations made about job satisfaction in existing studies. Particularly, the evidence provided in this investigation is consistent with the body of research explaining factors affecting job satisfaction, and empowering leadership are one of them.
Leadership by example and concern for the wellbeing of team members emerged as having the most substantial correlation with job satisfaction. This relationship is consistent with research studies developed by Gardner (2018), Negi and Dangwal (2019), highlighting the link between work environment and job satisfaction. This similarity in findings signifies the relationship between concern for employee wellbeing and an improved work environment. As stated differently, employees feel more comfortable in their workplaces when they know that their supervisors care for them. This feeling is satisfying beyond the monetary compensation they receive for the work they do. It is an intangible attribute associated with job satisfaction and has been mentioned in several studies, including those of Kaya and Karatepe (2020), Negi and Dangwal (2019), and Gardner (2018). Therefore, the views highlighted in this study are consistent with existing literature on the study area.
The findings highlighted in this paper also indicate the sentiments hotel workers hold towards empowered leadership practices in their respective organizations. They could be primarily explained by cultural practices and norms associated with the tourism and hospitality industry. More importantly, based on the views of Negi and Dangwal (2019), which outline organizational culture as a powerful tool affecting employer-employee relationships, some scholars argue that empowered leadership is asking for a radical shift in organizational culture from one of low trust to another of high trust (Kaya & Karatepe, 2020; Negi & Dangwal, 2019). An organization’s tolerance for risk would largely dictate the outcome that would emerge from this process. Therefore, the biggest challenge for organizations to address in this review context is empowering employees both realistically and perceptually.
Given the low level of trust between employers and employees and low pay characterizing the tourism and hospitality sector, Gardner (2018) draws attention to the importance of leaders being genuine in empowering their teams. The failure to do so would create mistrust among the players involved because perception is as important as reality. Therefore, when employees perceive management to be nonchalant about their well-being, they are likely to create a significant challenge in accepting and adopting empowered leadership practices. In line with this observation, Einola and Alvesson (2021) give examples of failed empowerment initiatives where management lacked employee buy-in due to mistrust and the perceived lack of interest to involve them in making important decisions.
Overall, there is an overlap of leadership characteristics in current and traditional organizational setups observed in the results indicated in this paper. This statement means that the current crop of leadership is exhibiting behavioral patterns similar to conventional leaders. This finding is consistent with existing scholarly literature, given that some researchers have observed the presence of consistent leadership behaviors among current and traditional leaders (Einola & Alvesson, 2021). For example, integrity and inspiration are values that emerge in both versions of leadership. Therefore, the data highlighted in this paper is consistent with the observations made by other researchers regarding leadership and job satisfaction.
Implication of the Findings
This paper shows that increased competition in the tourism and hospitality industry has prompted several organizations to undertake structural changes and improve their market appeal. These changes have been characterized by a paradigm shift that encourages the adoption of traditional leadership attitudes, such as firmness and control, to another, that embodies flexibility and efficiency. This study aimed to understand the correlation between empowering leadership practices and job satisfaction among employees working in the tourism and hospitality sector.
Empowered leadership practices were analyzed based on three key indices: leadership by example, showing concern for the welfare of team members, and involving employees in decision-making processes through participative leadership. The information gathered in the study was obtained using survey questionnaires, which were sent out to 60 employees working in the German hospitality industry, and the quality of leadership was measured using the ELQ items developed by Arnold et al. (2000). As highlighted in section 3.0 of this study, the respondents worked for 10 hotels in Germany and were introduced to the respondents through an acquaintance.
Using the SPSS technique, the researcher transformed the views gathered from the informants into qualitative data and analyzed their descriptive properties, including the mean, mode, median, standard of deviation, and variances, to answer the research questions. Additionally, the researcher used inferential and correlation techniques to control for the effects of demographic characteristics on the findings. The data obtained from the quantitative survey were analyzed using the SPSS technique. Particularly, the researcher used descriptive statistics and inferential and correlation methods to understand relationships between the main variables analyzed. The results showed that most of the employees reported high levels of job satisfaction and a belief in empowerment activities based on the leadership practices adopted in their organizations. The findings derived in this investigation also suggested that employees who reported high levels of job satisfaction did so due to their empowerment surroundings. Overall, these findings indicate that empowered leadership is positively correlated with job satisfaction levels in the tourism and hospitality industry, and the three hypotheses affirmed. The findings also suggested that employees who reported high levels of job satisfaction did so due to their empowerment levels. Overall, a positive correlation was established between job satisfaction and empowered leadership practices in the tourism and hospitality sector.
The findings derived from this study are relevant to hotels and tourism establishments willing to introduce and develop empowering leadership structures that would see their businesses navigate the uncertainties of the current global business environment. The findings highlighted in this study were developed from German employees working in its tourism and hospitality sector. Given the similarities in workplace culture between Germany and other European states, the findings of this study could be used to estimate the level of job satisfaction in other European states. For example, Germany has a similar culture to Austria, Belgium, and Norway. Therefore, the findings could be indicative of job satisfaction in these markets. Furthermore, stemming from the relationship between job satisfaction and culture, which is highlighted in this study, it could be assumed that the informants’ views could be similar to those of their counterparts in countries that share identical workplace cultures or leadership styles and practices.
Limitations and Further Research
Future researchers should explore the role of organizational constraints in influencing empowerment leadership behaviors in the workplace setting. This recommendation is based on an observation made by Arnold et al. (2000), which suggests that organizational characteristics may shape or influence leadership behaviors, thereby affecting their influence in the empowered leadership setting. Relative to this statement, future studies should explore the link between empowered leadership skills and other aspects of team performance, besides job satisfaction.
The findings of this study, which explain the correlation between empowered leadership practices and job satisfaction, should be limited to leadership attributes that enable employees to maximize their potential. This approach to management may differ from those aimed at improving profitability or maximizing shareholder interests. Therefore, the aim of the leadership practices adopted in this study is pertinent to adopting its findings. For example, the ELQ items used in the questionnaire were based on a review of items representing leadership activities and practices aimed at empowering employees. Therefore, it is pertinent to implement the findings within an empowered leadership context.
Data presented in this study also indicates the relationship between job satisfaction and leadership empowerment practices in the tourism and hospitality sector because there is a greater depth and substance to the analysis, which is not explored in the current investigation. Therefore, the findings represent an abstract relationship between job satisfaction and empowered leadership qualities in the industry. Consequently, there is a need to conduct an organization or industry-specific assessment of the correlation between empowered leadership practices and job satisfaction. Future studies should integrate more rigorous data collection and analysis techniques, such as interviews, for reviewing the findings highlighted in this document. This action is proposed because interviews provide an opportunity for a researcher to get richer and high-quality information, unlike the questionnaire survey technique employed in the current investigation, which only provides an abstract understanding of the research variables.
Alternatively, the sample size could be expanded in future research to capture more views from the respondents. The current investigation used a small sample size because of budgetary and logistic constraints. Future research investigations may overcome this limitation and sample respondents’ views in more hotels and across a broader geographical distance. Doing so would improve the quality of information obtained in the study by increasing the depths involved in understanding empowering leadership factors affecting job satisfaction. This finding implies that leaders working in the tourism and hospitality industry should invest their time and resources in empowering their employees because it would lead to higher levels of job satisfaction.
References
Akpoviroro, K. S., Bolarinwa, K. I., & Owotutu, S. O. (2018). Effect of participative leadership style on employee productivity. Journal of Economic Behavior, 8(1), 47-60.
Arnold, J. A., Arad, S., Rhoades, J. A., & Drasgow, F. (2000). The empowering leadership questionnaire: The construction and validation of a new scale for measuring leader behaviors. Journal of Organizational Behavior, 21(2), 249-269.
Audemard, J. (2020). Objectifying contextual effects. The use of snowball sampling in political sociology. Bulletin of Sociological Methodology, 145(1), 30-60.
Bureau of National Affairs. (2018). Bar graph of employee turnover rates by industry [Clip art]. Employer’s Choice Screening. Web.
Einola, K., & Alvesson, M. (2021). When ‘good’ leadership backfires: Dynamics of the leader/follower relation. Organization Studies, 42(6), 845–865.
Enns, P. K., Kelly, N. J., Masaki, T., & Wohlfarth, P. C. (2017). Moving forward with time series analysis. Research & Politics, 3(1), 1-10.
Eseryel, U. Y., Crowston, K., & Heckman, R. (2021). Functional and visionary leadership in self-managing virtual teams. Group & Organization Management, 46(2), 424–460.
Eurostat. (2020). Tourism industries – employment. Web.
Gardner, W. L. (2018). Riddle me this: What do mergers and acquisitions, remote workers,
management m-theory, empowered leadership, competitive human resource practices, and positivity within dynamic teams have in common? Answer: Outstanding 2017 GOM articles. Group & Organization Management, 43(6), 863–870.
Heimerl, P., Haid, M., Benedikt, L., & Scholl-Grissemann, U. (2020). Factors influencing job satisfaction in hospitality industry. SAGE Open, 2(1), 1-12.
Ilyas, S., Abid, G., Ashfaq, F., Ali, M., & Ali, W. (2021). Status quos are made to be broken: the roles of transformational leadership, job satisfaction, psychological empowerment, and voice behavior. SAGE Open, 7(2), 1-11.
Kaya, B., & Karatepe, O. M. (2020). Does servant leadership better explain work engagement, career satisfaction and adaptive performance than authentic leadership? International Journal of Contemporary Hospitality Management, 9(2), 1-10.
Kelly, D., & Nicholson, A. (2021). Ancestral leadership: Place-based intergenerational leadership. Leadership, 6(2), 1-10.
Knežević, M. N., Petrović, M. D., Kovačić, S., Mijatov, M., Vuković, D. B., & Kennell, J. (2021). Acting the part: Emotional intelligence and job satisfaction as predictors of emotional labor in travel agencies. Tourism and Hospitality Research, 21(2), 183–201.
Kundu, S. C., Kumar, S., & Gahlawat, N. (2019). Empowering leadership and job performance: Mediating role of psychological empowerment. Management Research Review, 42(5), 605-624.
Kunneman, M., Henselmans, I., Gärtner, F. R., Bomhof-Roordink, H., & Pieterse, A. H. (2019). Do shared decision-making measures reflect key elements of shared decision making? A content review of coding schemes. Medical Decision Making, 39(7), 886–893.
Negi, P. S., & Dangwal, R. C. (2019). Organisational sustainability through culture and managerial effectiveness: An Indian perspective. Journal of Entrepreneurship and Innovation in Emerging Economies, 5(1), 22–36.
Or, M. H., & Berkovich, I. (2021). Participative decision making in schools in individualist and collectivist cultures: The micro-politics behind distributed leadership. Educational Management Administration & Leadership, 3(1), 1-11.
O’Reilly Media. (2020). Participative leadership. Web.
Sablan, J. R. (2019). Can you really measure that? Combining critical race theory and quantitative methods. American Educational Research Journal, 56(1), 178–203.
Sanchez-Manzanares, M., Rico, R., Antino, M., & Uitdewilligen, S. (2020). The joint effects of leadership style and magnitude of the disruption on team adaptation: A longitudinal experiment. Group & Organization Management, 45(6), 836–864.
Shermon, G. (2017) Digital cultures: Age of the intellect. New York, NY: Lulu.com.
Sigala, M. (2021). Rethinking of tourism and hospitality education when nothing is normal: Restart, recover, or rebuild. Journal of Hospitality & Tourism Research, 45(5), 920–923.
Srivastava, S., & Pathak, D. (2020). The role of moderators in linking job crafting to organizational citizenship behaviour: A study on the Indian hospitality sector. Vision, 24(1), 101–112.
Walker, M. (2016). Hospitality in jeopardy: Organizing diverse low-wage service workers. SAGE Open, 5(1), 1-11.
Willis, P. (2019). Retroduction, reflexivity and leadership learning: Insights from a critical realist study of empowerment. Management Learning, 50(4), 449–464.
Yildirim, C. K., Altunalan, T., Acar, G., Elbasan, B., & Gucuyener, K. (2019). Cross-cultural adaptation of the developmental coordination disorder questionnaire in Turkish children. Perceptual and Motor Skills, 126(1), 40–49.
Zhao, J., & Li, S. M. (2018). The impact of tourism development on the environment in China. Acta Scientifica Malaysia, 2(1), 1-4.
Zheng, Y., Graham, L., Epitropaki, O., & Snape, E. (2020). Service leadership, work engagement, and service performance: The moderating role of leader skills. Group & Organization Management, 45(1), 43–74.
Appendix
Appendix 1: Questionnaire
The purpose of this study is to evaluate the nature of the relationship between empowering leadership practices on job satisfaction levels of employees in the tourism sector. This questionnaire is designed to sample your views on this topic, as part of the requirements for the fulfillment of my academic program. The document contains two parts. The first one will capture your personal details and the second one will evaluate leadership practices in your organization. Please, feel free to answer the questions honestly and candidly.
Part A: Demographic Data
Please tick (✔) the box that best describes you
Gender
- What is your gender?
- Male Female
- Diverse
Age
How Old Are You? …………………………………………
Marital Status
What is your marital status?
- Single
- Married
- Divorced
- Widowed
- Expanded
Education Qualification
What is your highest education qualification?
- Masters or Higher
- Bachelor’s degree
- Diploma
- High School
- Primary School or Lower
Employment Type
What is your employment type?
- Part-time Worker
- Full-Time Worker
Work Position
What position do you hold in your organization?
- Director
- Manager/Supervisor
- Front Desk Staff
- Maintenance and Cleaning Staff
- Restaurant Staff
- Others
Part B: Leadership Assessment
In this section, kindly answer some questions about how your superior behaves at work. The following statements may, or may not, describe their behaviors. Please, think about the behaviors of your manager/supervisor and circle the number that indicates how often they perform the behaviors described by the item.
Thank you for participating in the study!
*End*