Summary
Microsoft is considered the most successful multinational computer technology corporation in America. It was founded on April 4th, 1975, in a collaboration between Bill Gates, a former Harvard college dropout and Paul Allien (Gates 3). Microsoft has tremendously grown and has become the largest software company in the global rating. It has gained traction and international recognition as the best tech company in the world. Microsoft’s profitability has been on a significant rise among the revenue earners on a global scale when compared to Apple’s performance.
Apple Computers, Inc., on the other side, was established on April 1st, 1976, by Steve Jobs and Steve Wozniak. They adopted a new and transformative vision of changing human perceptions of computers. Steve and Wozniak wanted to make computers small and portable enough to enable people to own them in homes and offices (Akareem). In order to design, produce, and market smart and entertainment devices, including desktop computers and digital music players, Apple was founded. Apple mainly majored in online stores and direct sales to spearhead its activities. Such resulted in global recognition and quadrupling of their profit margin within a shorter period. Apple controls the largest segment of the market with high-end and essential leading high-tech accessories products sold across the globe.
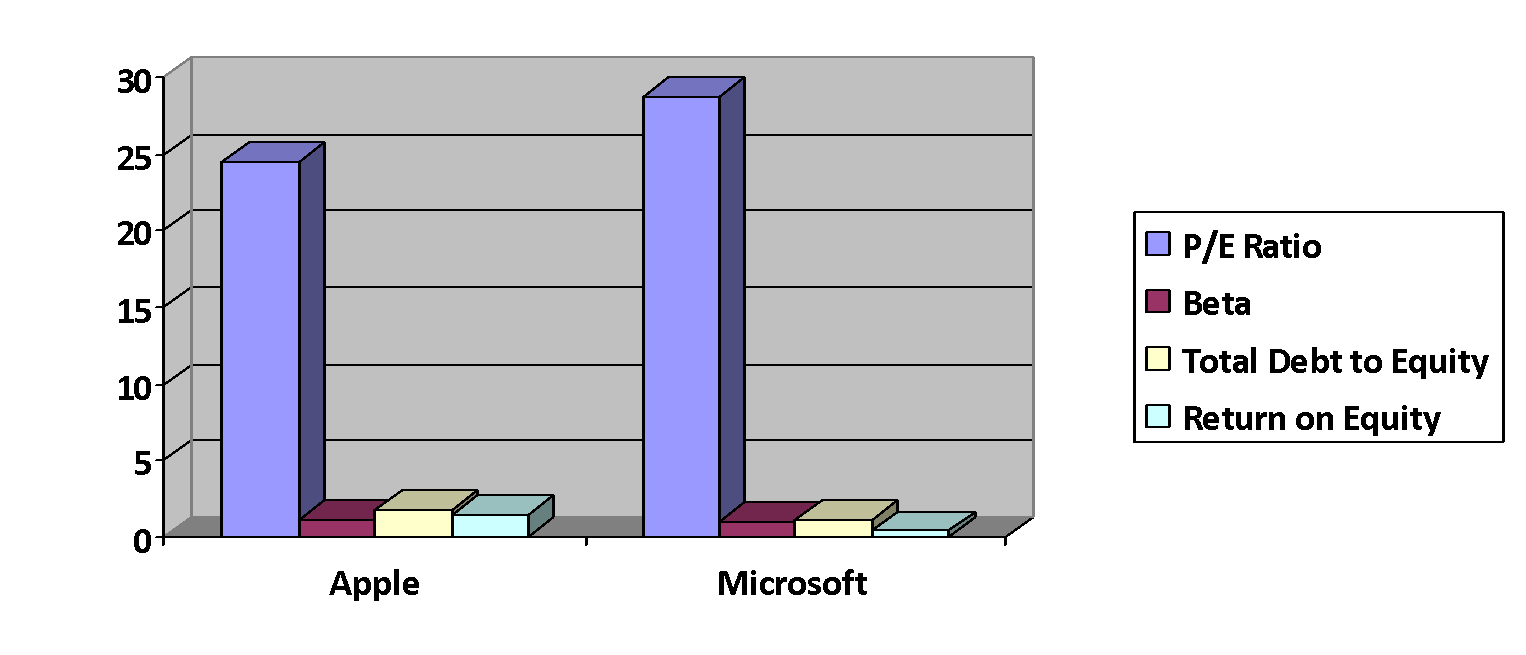
Comparison between Apple and Microsoft financial ratios
The figure below shows the comparison between Apple and Microsoft’s financial ratios performance based on the variables highlighted.
Ratio Analysis
Ratio analysis remains to have a vital role in any organization. According to Dutta et al., Apple has a P/E ratio of 24.51, which is relatively smaller than Microsoft. The P/E ratio measures the relationship between prices and earnings (Dutta et al. 12). Apple’s PE ratio implies that the company has a highly volatile and relatively lower growth in terms of revenue. The lower growth of revenues means a commutative revenue trailing behind the competitors with a higher P/E ratio. Therefore, compared to Microsoft, Apple lags in performance, particularly profitability. Microsoft has a P/E ratio of 28.69 as of July 2022, which is more than Apple’s by a significant portion (Dutta et al. 12). The higher value of Microsoft implies that the price per share earnings ratio is cumulatively high. The preferred direction of movement in ration should represent higher value and lower costs. In an ideal case, companies should witness the gap between prices and earnings, where the former decreases and the latter increases.
Such implies profitable performance, which attracts higher profits in terms of revenue. Therefore, a higher P/E for Microsoft indicates a stable financial condition for the company (Zandi et al. 5). Although both companies have relatively higher P/E ratios, the cumulative comparison places Microsoft as the head of Apple Company. P/E ratio is defined as the ratio of Price per-share earnings. Its formulae entail taking the latest closing price and dividing the closing price by the most recent earning per share number. The ratio is fundamental for the company as it facilitates the ascertainment of whether the stock of the company is highly valued or undervalued. Therefore, the ratio plays a crucial role in measuring the stock’s value in the company.
The PE ratio is advocated by several companies to be maintained between 20-25. The least value prevents the P/E from being undervalued, while the largest end of 25 helps maintain the overvaluing from an occurrence. The stipulated ranges act as an indicator that directs several actions of companies to value their P/E accordingly to attain profitable revenues during their operations. Apple’s ratio is lowly valued, while Microsoft is perceived to be highly valued (Zhang 455). The valuation is attributed to fluctuations in market forces and vital factors contributing to higher Microsoft values per-share earnings.
Based on the Beta analysis, Apple has a higher better of 1.19 than Microsoft, which has 0.93. Beta is a vital ratio that measures the level of a stock’s volatility about the general market trends. Similarly, those with less than 1 have a comparatively smaller deviation from the market. According to Apple’s beta ratio, it is found to have higher volatility relative to Microsoft, which has smaller. For instance, with 1.19, Apple is 19% more theoretically volatile than the market (Caporale et al.). Microsoft has a better ratio of 0.93, indicating that its market volatility is slightly lower than Apple’s. High volatility associated with Apple Company resulted in high fluctuation of the company stock values such affected the profitability and general financial conditions. It rendered it unstable as compared to the market status.
Furthermore, the total debt to equity ratio is the ratio that compares a company’s total liabilities with shareholder’s equity. The efficacy of the ratio can evaluate the number of leverage that the company uses in the course of its operation. Apple has a higher Total debt to Equity ratio of 1.78 compared to Microsoft, with 1.12 (Paramitha). While a higher debt-to-equity ratio implies a higher risk to the company’s shareholders, Apple has a higher risk regarding its stock toward the stakeholders than Microsoft. This affects its financial position negatively as high risk often discourages investments in the company. The evaluation of the debt-to-equity ratio is calculated using the formulae, total liabilities divided by total shareholders’ equity. Generally, companies prefer the Debt to Equity ratio of 1-1.5, a desirable range that attracts satisfaction from investors.
Moreover, return on equity implies the duration a company takes to return on the investments it receives from the shareholders. Apple has a higher Return on investment (ROE) than Microsoft, which has 48%. Microsoft’s return on equity plays a role in attracting customers (Stewart et al. 2). Therefore, favorable estimates indicate the company’s profitability which acts as a catalyst to attract investors. The return on equity calculation is achieved by dividing the company’s net income by the average shareholder’s equity. Efficacy of the ROE indicates the company’s efficacy in using the equity attainable from shareholders to generate income. Despite the differences in percentages, Microsoft has outperformed Apple regarding return on equity. This is realized particularly in the percentage attained about shareholder’s equity.
Microsoft’s company profitability differs from Apple’s due to several economic factors. The investment portfolio in Microsoft highly favors direct investors, considering the less volatility of its stock. For instance, an analysis of the Beta ratio shows how important the financial ratio is in attracting investors (Wen). While investors tend to observe performance, their primary interest is companies with fewer financial risks. Since a higher beta ratio is associated with higher risk, investors tend to shun Apple, thus deviating toward Microsoft. ROE plays a crucial role in attracting investors. Every investor prefers observing how long it will take to return his shares. As a result, Microsoft outperforms its competitors due to relatively higher ROE. This acts as a key attractive indicator for their investors.
Finally, I would recommend that Microsoft should be the best option in the case of aims at investing. The rationale behind that can be explained by the analysis provided above, which demonstrates that Microsoft has better performance rates by both P/E ratio and Return on investment (ROE). For instance, Microsoft stock average prices have been curtailing on a relatively higher value than Apple’s. The profitability margin has been higher, and less volatility has been experienced in its stocks. Such elements are attributed to effective management, which is crucial for success. Therefore, investing in Microsoft is worth the returns as compared to Apple.
Works Cited
Akareem, Husain S. “Report on Apple (IMac).” School of Business & Economics (SBE), 2018, pp. 1–20. Web.
Caporale, Guglielmo Maria, Luis A. Gil-Alana, and Miguel Martin-Valmayor. “Persistence in the Realized Betas: Some Evidence for the US Stock Market.” (2022).
Dutta, Kumar Debasis. “Determinants of P/E Ratio: An Empirical Study on Listed Manufacturing Companies in DSE”. International Journal of Scientific and Research Publications (IJSRP), vol. 8, nr. 4, 2018. Crossref.
Stewart, Craig. “Return on Investment in Research Cyberinfrastructure: State of the Art”. Practice and Experience in Advanced Research Computing, 2022. Crossref.
Wen, Fenghua. “Dynamic volatility spillovers and investment strategies between the Chinese stock market and commodity markets”. International Review of Financial Analysis, vol. 76, 2021, p. 101772. Crossref.
Zandi, GholamReza, Imran Ahmed Shahzad, and Vigneswari Lokanathan. “Financial ratios and company stock performance: an empirical study of public companies listed on shanghai stock exchange (SSE).” Academy of Entrepreneurship Journal 27.6 (2021): 1-9.
Zhang, Xiwen. “Analysis of Business Model and Financial Operation: Evidence from Apple”. Proceedings of the 2022 2nd International Conference on Enterprise Management and Economic Development (ICEMED 2022), 2022. Crossref.