Introduction
Background Information
Depression is a significant health concern that affects healthcare systems around the globe. Mental Health Foundation (MHF, 2016) defines depression as a common mental health condition associated with a feeling of being depressed, loos of interest or pleasure, feeling of guilt, sleeping problems, loss of appetite, and poor concentration. According to the Anxiety and Depression Association of America (ADAA, 2021), 40 million adults in the US are affected by depression, which is more than 18% of the population of the country. MHF (2016) estimated that almost 20% of the UK’s population aged 16 and above demonstrate the symptoms of depression. World Health Organization (WHO, 2020) reports that more than 264 million people of all ages have symptoms of depression globally. Moreover, depression is a major cause of disability and suicide (WHO, 2020). While the condition is well-studied, the topic of factors that contribute to depression remains a matter of increased discussion among scholars, policymakers, and practitioners.
Purpose Statement
The purpose of the present paper is to determine how alcohol misuse, access to healthcare, and ethnicity affect the risk of having depressive symptoms. The research aims at examining secondary data provided by the Centres of Disease Control and Prevention (CDC) to conduct quantitative analysis. In particular, a dataset created as a result of the Behavioural Risk Factor Surveillance System (BRFSS) for 2019 was used to achieve the purpose.
Importance
The knowledge of risk factors is crucial for the promotion of screening and prevention measures. According to the National Institute of Health (NIH, 2016), knowledge of risk factors increases the chances of having good health by eliminating, minimising, or substituting the risks with less threatening ones. Identification of risk factors also helps to improve screening effectiveness, which promotes early diagnosis and treatment of a condition. Thus, the present paper is expected to contribute to reducing morbidity and mortality from depression by adding empirical evidence about risk factors contributing to depression to the current body of knowledge.
Literature Review
Overview
The present section provides a brief review of existing literature about risk factors contributing to depression. The section is organised in subsections that summarise evidence concerning one or a group of risk factors. The aim of the literature review is to identify gap literature that can be addressed using the BRFSS dataset.
Social Determinants of Depression
Social determinants of depression include gender, race/ethnicity, and socioeconomic status (SES). Recent empirical research conducted by Assari (2017) on the effect of race, gender and SES on the risk of major depressive episode (MDE) occurrence. Quantitative analysis of the National Survey of American Life (NSAL) revealed that race and household income have a significant impact on the occurrence of MDE (Assari, 2017). These findings were seemingly inconsistent with the statement that females are more likely to have depression than males (WHO, 2021; Kuehner, 2017). However, Assari (2017) notes that there is an indirect link between gender and risk of depression, as SES affect women more than men. At the same time, Di Florio et al. (2017) stated that ethnicity had no effect on the risk of having postpartum depression. However, Leung et al. (2014) report that people that have a fear of being discriminated against are more likely to have depressive symptoms than others. Thus, it appears that while all researchers agree that gender and SES are directly or indirectly affect the risk of having depression, there is no certainty about the relationships between depression and race.
Health Conditions
There are some health conditions that positively correlate with the risk of having depression symptoms. Hedley D. et al. (2018) state that Autism Spectrum Disorder (ASD) often leads to depression. The reason for the matter is that patients with ASD usually have limited social contacts and are prone to alienation, which, in turn, leads to feeling depressed (Hedley, D. et al., 2018). According to Baksa, GonDa, and Juhasz (2017), migraines also contribute to the risk of having depression in all populations. The underlying reason for the correlation between the two conditions is complex biopsychosocial mechanisms affected by environmental, genetic factors (Baksa, GonDa, and Juhasz, 2017). At the same time, Juengst, Kumar, and Wagner (2017) state that traumatic brain injury (TBI) often leads to depression. Depression may develop due to the direct influence of TBI, such as changes in brain functions (Juengst, Kumar, and Wagner. 2017). Patten et al. (2018) also stated that chronic conditions, such as arthritis, diabetes, back pain, cataracts, stroke, and heart disease, may contribute to the risk of developing depression. Thus, numerous health conditions contribute to depression risks.
Alcohol Misuse
Alcohol misuse and depression have been known to have significant correlations for a long time. Deykin, Levy, and Wells (1987) conducted screening for depression among 424 college students aged 16 to 19 years with drug or alcohol dependency. The results revealed that depression was more prevalent among drug and alcohol misusers than among the general population (Deykin, Levy, and Wells, 1987). Kosciusko et al. (2019) noted that there was a higher prevalence of depression among cancer patients with alcohol misuse than among cancer patients without alcohol misuse. Hasin and Click (1993) examined a large sample of the general population to assess the prevalence of suicide intentions, alcohol misuse, and major depression. The results revealed that these three conditions are correlated due to serotonin neurotransmitter deficits (Hasin and Click, 1993). Thus, the literature review demonstrated that while depression and alcohol misuse were correlated, there was no causal link established between the two conditions.
Access to Care
Little is known about the relationships between access to care and depression. Leung et al. (2014) stated that Latinos were more likely to have depression symptoms if they had concerns about access to care. Knaak, Mantler, and Szeto (2017) stated that there was much stigma associated with depression treatment, which created significant problems with access to care. As a result of decreased access to care, depression was untreated in a large proportion of patients, which aggravated depression symptoms. Thus, even though it is suggested that access to care and depression are negatively correlated, the body of empirical evidence confirming the matter is small.
Summary and Gap Identification
In summary, the literature review revealed that the possible factors that affect depression include gender, ethnicity, SES, comorbidities, alcohol misuse, and access to care. The comorbidities associated with an increased chance of depression were ASD, migraines, TBI, arthritis, diabetes, back pain, cataracts, stroke, and heart disease. At the same time, the relationships between ethnicity and depression were unclear due to contradictions in the reviewed literature, the causal relationships between alcohol misuse and depression were not established, and the body of evidence concerning the relationships between access to care and depression were unclear. The present paper aims at addressing the three uncertainties revealed in the literature review.
Methods
The present paper is a cross-sectional quantitative study that aims at determining risk factors of depression. The primary aim of the quantitative analysis is to assess the significance of the influence of access to care, ethnicity, and alcohol misuse on the chance of developing depression symptoms. Cross-sectional studies make inferences about the data gathered during a specific point in time (Baarda, 2010). The method is associated with low costs, assessment of multiple variables, and creation of explanatory models, such as regression equations (Baarda, 2010). The disadvantages of cross-sectional methods include lack of control over the environment, inability to identify cause-effect relationships, and inability to analyse behaviour during a period of time (Baarda, 2010). The utilisation of secondary data is also associated with several flaws, such as poor control over variables and lack of knowledge about the methods of data collection (Baarda, 2010). However, the use of secondary data is convenient, as it helps to make the research cheaper and faster. Additionally, secondary data acquired from reputable sources, such as CDC, is highly reliable. Such a level of data collection is difficult to achieve in field research.
Dataset
The study utilises a dataset provided by BRFSS for 2019 to create a regression model that predicts depression symptoms. BRFSS is a system of telephone surveys that collects data about US residents in all 50 states concerning health-related risks. BRFSS is considered the largest continuously conducted health survey system in the world (CDC, 2020). All the data is collected following strict protocols of data collection and storing, making it appropriate for the study. The initial dataset included 342 variables and 418,268 responses.
Variables
A total of four variables from the dataset were utilised for the analysis. The dependent variable was depression, which was measured using the MENTHLTH variable from the dataset. The variable represented the number of days during the past 30 days the respondent experienced mental health problems, including stress, depression, and anxiety. The independent variables included binge drinking (@_RFBING), access to care (CHECKUP1), and race (RACEGR3). The @_RFBING is a categorical variable, which demonstrated if the respondent had four or more drinks on one occasion. The CHECKUP1 variable demonstrated when the respondent had the last routine visit to a hospital. The @_RACEGR3 variable categorised respondents into five groups of ethnicities. Table 1 below demonstrates the codes for variables.
Table 1. Variables
Data Analysis Procedure
The data was analysed using descriptive statistics and regression analysis. First, the frequency tables were created for all the independent variables using SPSS. Second, the data was cleaned by deleting all rows where the dependent variable was higher than 30 days. The values of “88” were replaced with “0” as it represented that respondents had no occurrences of mental health problems. Finally, regression analysis was performed. The results were analysed by interpreting the p-values for the coefficients and the R2 coefficient. All the commands for SPSS analysis are provided in Appendix A.
Results
Descriptive Statistics
Table 2 below demonstrates the frequencies table for the race variable (@_RACEGR3). The analysis shows that the majority of respondents were whites.
Table 2. Frequency table: Race
Table 3 below demonstrates the frequency table for the binge drinking variable (@_RFBING). The table shows that 12.5 of respondents drank four or more drinks on one occasion.
Table 3. Frequency table: Binge drinking
Table 4 below demonstrates the frequency table of the access to health variable (CHECKUP1). The table shows that almost 80% of respondents had a routine visit to a doctor during the past year.
Table 4. Frequency table: Access to care
Table 5 below demonstrates descriptive statistics for the dependent variable (MENTHLTH) after cleaning the data. The mean number of days when the mental health was not good among respondents was 3.87 with a standard deviation of 8.1.
Table 5. Descriptive statistics: Depression
The crosstab analysis is provided in Appendix B.
Regression Analysis
The results for coefficient estimations are provided in Table 6 below. The results demonstrate that access to care and race were significant predictors of the number of days the mental health of respondents was not well (p < 0.001). However, binge drinking had no significant effect on the dependent variable. At the same time, it should be noticed that the predictive ability of the model was very low (R2 = 0.001).
Table 6. Regression analysis results
Discussion and Conclusion
The analysis provided in the present paper revealed that access to care and race were significant predictors of depression, while binge drinking was not a risk factor for developing depression. First, the results of the present study are in accord with Assari (2017), while they are inconsistent with Di Florio et al. (2017) and Leung et al. (2014), as the race was found to have a significant effect on the risk of developing depression. Second, the results of the present research added to the existing body of knowledge by providing evidence that there is a significant link between access to care and the risk of depression. Finally, the research results were inconsistent with research conducted by Deykin, Levy, and Wells (1987), Kosciusko et al. (2019), and Hasin and Click (1993). In summary, the results of the present study were controversial.
Strengths and Limitations
The primary strength of the present study is the sample characteristics. The sample size is large and includes a wide diversity of special populations, which positively influences the reliability of findings. Additionally, the data collection methods are also a significant strength. CDC utilised strict protocols for data collection and repeatedly checked for the quality of collected data to prevent bias. Finally, the data analysis methods used for the present study also add to the reliability of findings, as statistical analysis is associated with minimum bias.
While two of the assessed risk factors were found statistically significant, the characteristics of the model limit the usefulness of the findings. The R2 coefficient suggests that the assessed model has a very low predictive ability, which implies that there are numerous factors that contribute to the risk of developing depression symptoms. Another limitation of the present study is the measurement of the dependent variable. The major concern with the variable is that it measures not only depression but also cases of anxiety and stress. Thus, the results of the study may be biased.
Recommendations for Future Research
Future research should focus on confirming the results of the present study by addressing its weaknesses. In particular, an improved method for measuring depression to isolate it from other conditions. Additionally, other independent variables should be added to improve the predictive ability of the regression model.
Reference List
Anxiety and Depression Association of America (2021) Facts & statistics. Web.
Assari, S. (2017) ‘Social determinants of depression: The intersections of race, gender, and socioeconomic status’, Brain Sciences, 7(12), pp. 156-168.
Baarda, B. (2010). Research: This is it! Groningen: Noordhoff.
Baksa, D., GonDa, X., and Juhasz, G. (2017) ‘Why are migraineurs more depressed? A review of the factors contributing to the comorbidity of migraine and depression,’ Neuropsychopharmacologia Hungarica, 19(1), pp. 37-44.
Centres of Disease Control and Prevention (2020) Behavioral risk factor surveillance system. Web.
Deykin, E. Y., Levy, J. C., and Wells, V. (1987) ‘Adolescent depression, alcohol and drug abuse’, American Journal of Public Health, 77(2), pp. 178-182.
Di Florio, et al. (2017) ‘The impact of education, country, race and ethnicity on the self-report of postpartum depression using the Edinburgh Postnatal Depression Scale’. Psychological Medicine, 47(5), pp. 787-807.
Hasin, D. S. and Click, H. (1993) ‘Depressive symptoms and DSM‐III‐R alcohol dependence: general population results’, Addiction, 88(10), pp. 1431-1436.
Hedley, D. et al. (2018) ‘Risk and protective factors underlying depression and suicidal ideation in autism spectrum disorder’, Depression and anxiety, 35(7), pp. 648-657.
Knaak, S., Mantler, E., and Szeto, A. (2017) ‘Mental illness-related stigma in healthcare: Barriers to access and care and evidence-based solutions’, Healthcare Management Forum, 30(2), pp. 111-116.
Kosciusko, R., et al. (2019) ‘Substance use, depression, and illness perception among cancer patients’, American Journal of Health Behavior, 43(2), pp. 287-299.
Juengst, S. B., Kumar, R. G., & Wagner, A. K. (2017). A narrative literature review of depression following traumatic brain injury: Prevalence, impact, and management challenges. Psychology Research and Behavior Management, 10, Article 175-186.
Kuehner, C. (2017) ‘Why is depression more common among women than among men?’ The Lancet Psychiatry, 4(2), pp. 146-158.
Leung, P. et al. (2014). ‘Factors contributing to depressive symptoms among Mexican Americans and Latinos’, Social Work, 59(1), pp. 42-51.
Mental Health Foundation (2016) Fundamental facts about mental Health. Web.
National Institute of Health (2016) Understanding health risks. Web.
Patten, S. B. et al. (2018) Patterns of association of chronic medical conditions and major depression. Epidemiology and Psychiatric Sciences, 27(1), pp. 42-56.
World Health Organization (2020) Depression. Web.
Appendix A: SPSS Commands
FREQUENCIES VARIABLES=@_RACEGR3 @_RFBING5 CHECKUP1
/ORDER=ANALYSIS.
CROSSTABS
/TABLES=MENTHLTH BY @_RACEGR3 @_RFBING5 CHECKUP1
/FORMAT=AVALUE TABLES
/CELLS=COUNT
/COUNT ROUND CELL.
DESCRIPTIVES VARIABLES=MENTHLTH
/STATISTICS=MEAN STDDEV MIN MAX.
USE ALL.
COMPUTE filter_$=(MENTHLTH <= 30).
VARIABLE LABELS filter_$ ‘MENTHLTH <= 30 (FILTER)’.
VALUE LABELS filter_$ 0 ‘Not Selected’ 1 ‘Selected’.
FORMATS filter_$ (f1.0).
FILTER BY filter_$.
EXECUTE.
REGRESSION
/MISSING LISTWISE
/STATISTICS COEFF OUTS R ANOVA
/CRITERIA=PIN(.05) POUT(.10)
/NOORIGIN
/DEPENDENT MENTHLTH
/METHOD=ENTER @_RACEGR3 @_RFBING5 CHECKUP1.
Appendix B: Crosstab Analysis
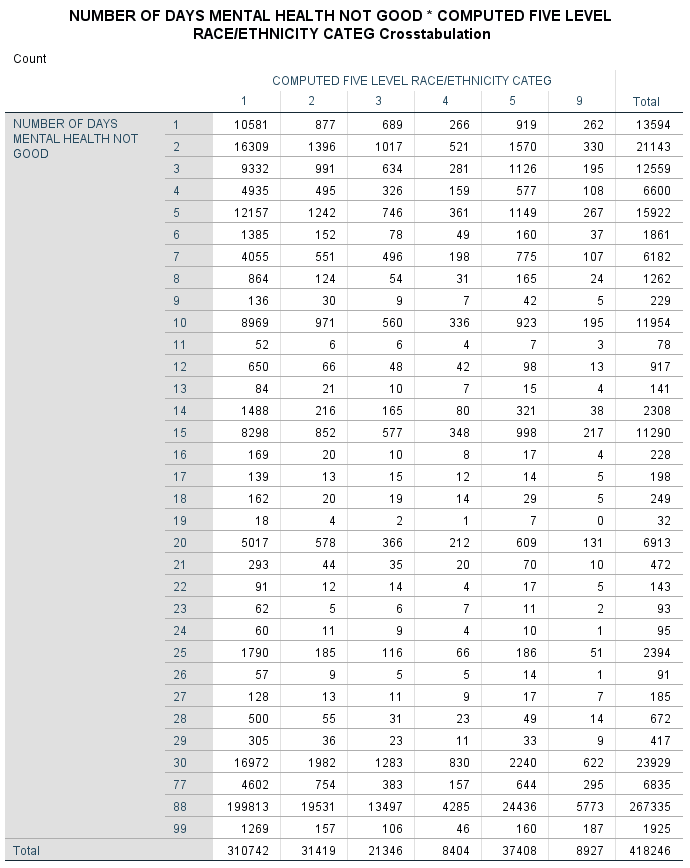
No evident peculiarities in distribution were found after analysing the present crosstab.
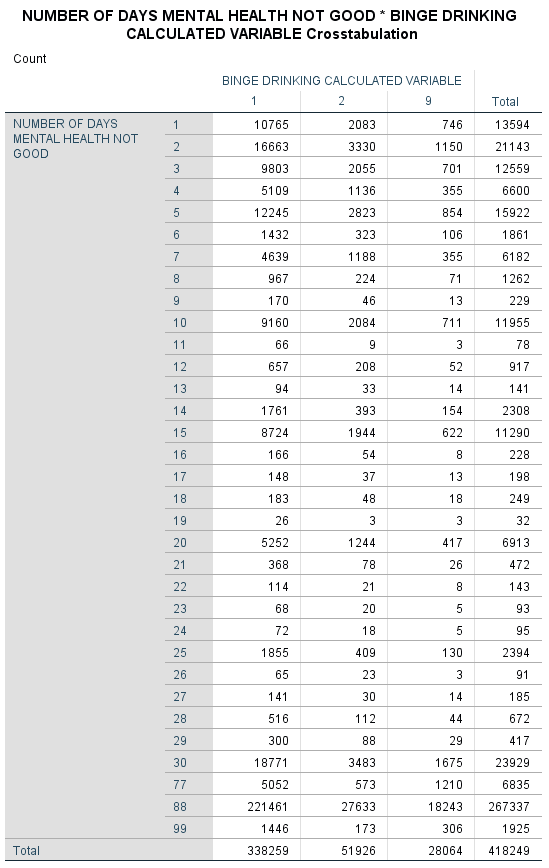
The major finding of the present crosstab analysis is that 18.5% of people who had bad mental health for 30 days were binge drinkers, while only 12.5% of people who did not report any days with bad mental health were binge drinkers.
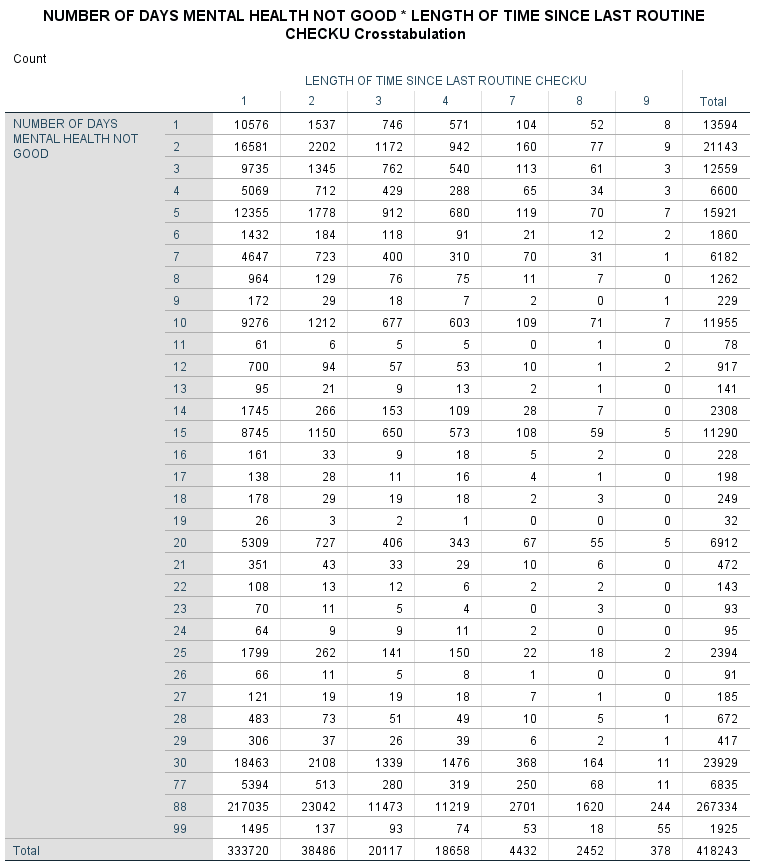
The analysis shows no peculiar distributions that can be highlighted.