Introduction
Etihad Airways is a national airline company in United Arab Emirates that was established by a royal decree as the national carrier of UAE and first started commercial operations in 2003. The services of the airline are classified as Business Class, First Class, Economy Class, high end lounges, and limousine pick-up services in more than 20 destinations across the globe (Etihad Airways, 2016). This paper will carry out advanced strategic management analysis of the company for a period of three years from 2008 to 2010. The analysis will reflect of the vision/mission, internal organization environment, and external organization environment. The paper will then present strategic recommendations to address any shortfall noted.
Mission / Vision
The vision and mission of the Etihad Airways have similar components on quality services and the need to appeal to the global market. However, Etihad’s mission is concentrated in partnership with customers rather than just selling services as is the case with the other competitors.
Apparently, the vision of the business is to be leading reliable air travel and cargo handling carrier that offers cultured and comfortable services to clients across the globe. The company had achieved this vision since its operations have been expanded beyond the UAE, despite having been in the market for less than 15 years. The mission of the business is to grow the airline business platform to cover specific demands for clients by rolling out an easy to access, use, and personalize products and services through partnering with all the stakeholders (Harrison & John, 2010).
This mission is strategic since it acts as a guideline in the current and future expansionary policies within and without the UAE. Besides, the mission statement is ideal for guiding the management and other personnel on the growth strategies and the need to guarantee efficiency when meeting customer desires. Apparently, the aspects of customer, service quality, reputation for best services, and proactive labour force integration in Etihad have been internalised in the company vision and mission statements.
However, there is need to integrate the philosophy of customised services and holistic approach to doing business for the vision statement to align to the current plan for global expansion that will incorporate many cultures. This can be achieved through remodelling the current local approach to doing business by introducing the global culture characterised by flexibility in services delivery and unilateral customer centricity (Harrison & John, 2010).
Internal Assessment
Financial ratio analysis
Based on current ratio, the liquidity of the company improved. This is an indication that the company is able to settle immediate obligations using current assets. The debt to worth ratio dropped indicating that the gearing level of the company improved. Return on assets also improved over the period indicating that the company is efficient in use of assets. Earning per share and other ratios improved, indicating that the overall financial gearing of the company is positive.
Organizational chart
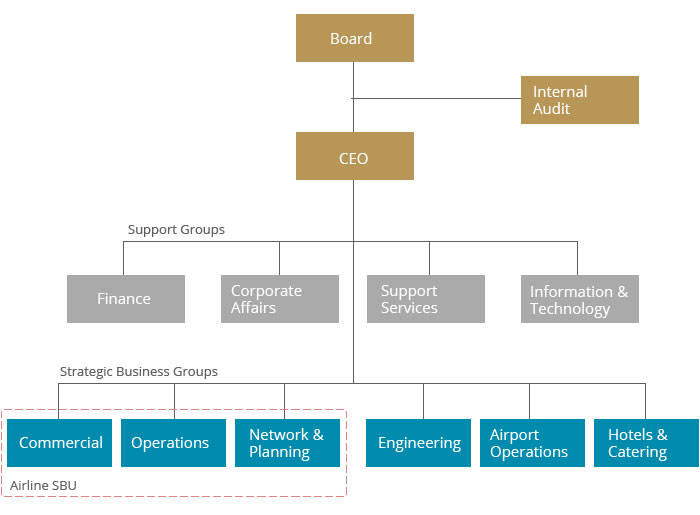
This chart indicates that Etihad is dynamic organization. The chart has clear definition of roles and well-balanced management team. However, more positions such as marketing department should be created as part of the support groups since the company is very large.
Etihad’s Operations Map
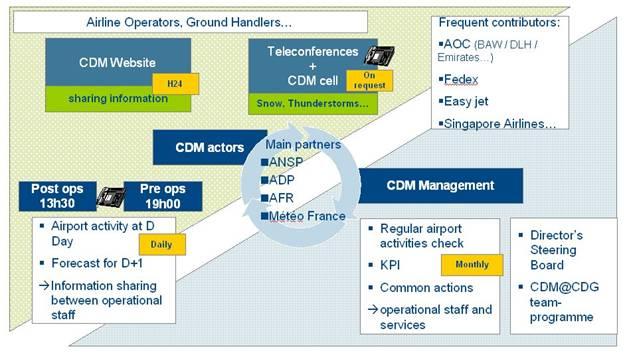
Reflectively, relating information on success of operations is dependent on operations strategy for value maintenance. In the process of balancing the act, a quality operations management system should be capable of applying the scientific skills in an artistic manner through informed and perfectly framed use of soft skills to address technical aspects of production management (Slack, 2012).
Generally, the quality operations management system at the Etihad Airways is that which satisfies requirements within the budget and time schedule without disintegrating initial goal projections (Etihad Airways, 2016). Since its inception, the company has maintained positive growth and expansion of profits as a result of the efficiency maintenance strategies. The company has an efficient operations module as indicated in the above map. However, there is need to automate the entire process to make it ideal for business practices in the 21st century.
Marketing Strategy
The company has adopted the product proliferation strategy to penetrate the UAE Airline Industry within the Gulf region. Etihad is a leading airline in the global flight arena and offers some of the safest and most affordable flights to passengers. Every household within and beyond the Persian Gulf consists of potential customers of Etihad. With the need to be a head of its competitors, Etihad adopted the strategy of maximum comfort in the first class cabin, spacious airplanes and a variety of meals served on flights at Etihad. This has enabled the company to create multiple products that are very unique to its line of business.
The products are marketed as multiple to suit different classes of customers. This strategy has improved the visibility of the company products besides creating an environment of own competition since multiple branding has created demand for the high-end and low-end customers (Escrig-Tena et al., 2011). However, the current market strategy has not embraced technology fully. This means that Etihad should use the social media and other online marketing strategies to reach to the young customers. If well implemented, the company may increase its current sales by 20%.
IFE Matrix
The IFE Matrix for Etihad is summarised in the table below.
The most important factors are brand name, innovative products, and low debt as indicated in the high weighted score of 0.56, 0.52, and 0.52 respectively. This means that the competitive advantage of the company is based on these factors.
External Assessment
Major competitors
The two major competitors of the Etihad Airways are the Fly Emirates and Royal Jet. The two companies have been in the market for longer time and target the same market. Currently, Fly Emirates is the most dominant followed by Etihad with the Royal Jet being in the third position. However, the Royal Jet dominates the luxury product segment with Etihad being in the third position. In terms of size, Fly Emirates is the largest with more than 300 planes followed by Etihad at 255 planes. Royal Jet has less than 100 planes.
CPM.
EFE.
The most important factors are partnership with other subsidiary companies, expansion of the current products, and creation of an innovative cargo handling service as indicated in the high weighted score for the three factors.
Strategy Formulation
SWOT matrix with strategies
SPACE matrix, Factors and Scores
Apparently, the positive figures indicate that Etihad is well positioned to survive in the current market and make positive progress in the future. However, the company must reinvent its competitiveness to change the negative results into positive value.
BCG Matrix
Apparently, the company should improve on its promotion of the corporate transfer product segment since the growth rate was -10%.
Grand Strategy matrix
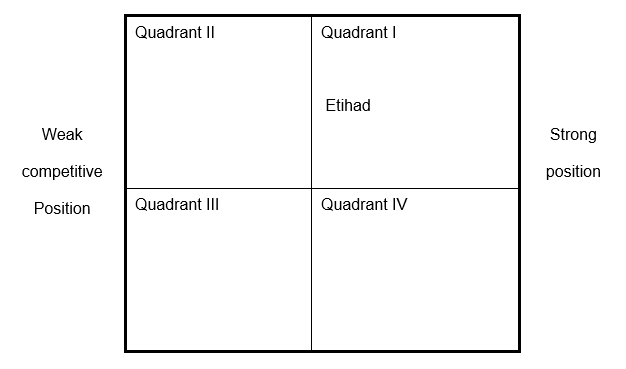
Apparently, the company has a very vigorous market growth and relatively strong position on competition since it falls in the first quadrant. This means that the most sustainable strategies for the company are horizontal integration and market development.
Recommendations
Existing strategies to be continued
The company should continue with it current market development strategies to further improve its competitive advantage as established in the score on SPACE and BCG matrices. The market development strategies may be in the form of increasing products, opening more subsidiary branches across the globe, and integrating the current products and services to be compatible across the globe (Dewhurst et al., 2012).
New strategies to be commenced
The company should consider introduction of horizontal integration to create a dynamic business model that can accommodate the constantly changing airline business environment (Bodily & Allen, 2009). The vision of the program will be to create an ideal climate for innovation and integration of different product segments into a complete and sustainable business.
References
Bodily, E., & Allen, M. (2009). A dialogue process for choosing value-creating strategies. Interfaces, 29(6), 16-28.
Dewhurst, M., Harris, J., Heywood, S., & Aquila, K. (2012). The global company’s challenge. McKinsey Quarterly, 3(1), 76-80.
Escrig-Tena, A., Bou-Llusar, C., Beltran, M., & Roca-Puig, V. (2011). Modelling the implications of quality management elements on strategic flexibility. Advances in Decision Sciences, 1(1), 1-27.
Etihad Airways. (2016). About us. Web.
Harrison, J., & John, C. (2010). Foundations in strategic management. Ohio, Oh: South Western Cengage Learning.
Slack, N. (2012). Operations and process management: Principles and practice for strategic impact. Alabama, Al: Pearson Education Limited.