This end of project report aimed at evaluating the effectiveness of the implementation of the sound system installation project in Doha, Qatar, for Adwar Enterprises. Even though the project was completed with a significant delay, it is considered a success, as all the planned activities were accomplished on budget, and the customer was satisfied with the provided services. The final cost of the project was 175,480 QR, which was above the initially planned cost of 150,000 QR but below the budget cap of 200,000 QR. The project started on April 3 and ended on June 6. The primary success factors of the project were careful stakeholder management, communications management, and risk management. Several crucial mistakes were identified, and recommendations were given for future projects of similar scope.
Introduction
This end project report aims at discussing the results of the sound system installation project and evaluating its outcomes. The report provides a detailed analysis of the triple constraint of scope-schedule-cost and assesses the quality assurance procedures along with process control and risk management. The primary purpose of this report is to provide a list of recommendations for future improvement of similar projects.
This report is divided into three major sections. The first section discusses the background of the project by briefly introducing the purpose of the project, its sponsor, and the actor. Additionally, the first section briefly describes the planned activities, timeframe, and budget. The second section discusses in detail all aspects of the project outcomes, including its scope, scheduling, budgeting, quality management, human resources, stakeholder management, communications, and risk management. The third section provides detailed recommendations for future projects using the results of the analysis.
Project Background
The purpose of the project was to install a Hi-Fi sound system in a newly-constructed building in Doha, Qatar. The client of the project was Adwar Enterprises, one of the largest real estate companies located in Doha. In 2021, the company finished the construction of a new building in the city. However, the customer satisfaction level with the building was low. Brief marketing research revealed that one of the complaints was the absence of a sound system in the building. Thus, a project was for installing the sound system was proposed to improve the overall customer satisfaction and retention levels.
Adwar Enterprises was established in 2014 to meet the growing real estate needs in Qatar associated with the preparations for FIFA World Cup 2022 (Adwar Enterprises, 2022). The company provides real estate solutions for individuals or corporations that want to lease, buy or sell their properties. The company’s vision is to create a world of innovative real estate solutions where the client comes first (Adwar Enterprises, 2022). The company is proud of its high-skilled staff, which it sees as its primary success driver. Adwar Enterprises is known for “excellence in service, quality, trust, and delivery” (Adwar Enterprises, 2022, para. 6). Thus, the purpose of the project was coherent with the company’s vision and values.
Project Overview
The project was planned to start on April 3, 2021, and finish on May 17, 2021. The sponsor’s final deadline was May 25, which allowed the project seven days of slack. The project’s budget was 200,000 QR, with the planned actual cost being 150,00 QR. The project included the installation of the system, quality check, and a training program for the personnel. Three major deliverables included the installation of the sound system network in the building, installation of the sound system and microphones in all the sites where the sound system was available, and a training session for using the new equipment.
The project team was initially planned to include seven members. They were the project manager, the fulfilment director, a quality assurance manager, a financial manager, a human resource (HR) specialist, a risk manager, and a training manager. The project had five major phases visualised in Figure 1 below.
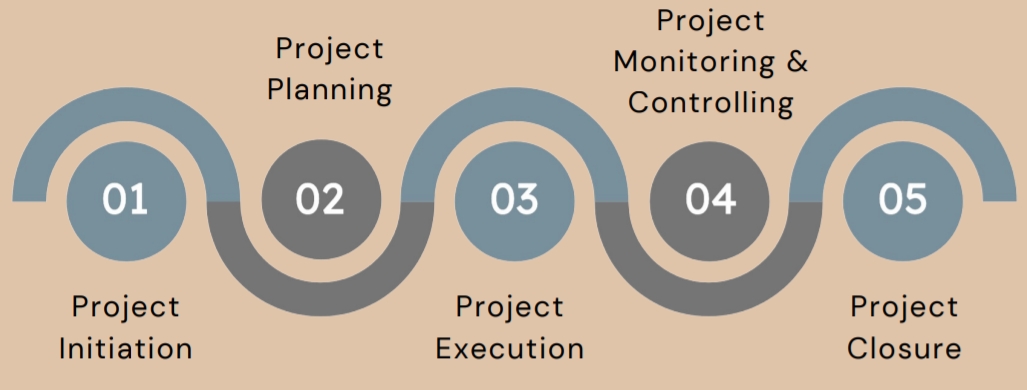
Initially, it was planned that the first three stages would take up eight days each, the third stage was expected to take 16 days, the fourth stage was planned to last for 15 days, and the final stage was scheduled to take five days. However, major changes were made to the project schedule and the project team to increase the efficiency of the project delivery process and ensure that all the activities were completed in time. The section discusses all the changes and associated outcomes in detail.
Project Scope
Project scope is defined as a detailed outline of all the aspect of a project, including all the activities, resources, and deliverables (Meredith and Mantel, 2011). Clear identification of a project’s scope helps to gain a bird’s eye view of the project and manage the expectations of the stakeholders effectively (Martinelli and Milosevic, 2016). One of the most frequently used tools for managing the activities of the scope is Work Breakdown Structure (WBS). WBS is an outline of all the activities that help to understand the flow of the activities and control the project’s implementation. The initial WBS of the project is provided in Appendix A.
The project’s initial scope was poorly identified during the initial planning, which led to drastic changes in the project’s WBS. In particular, the number of activities decreased from 33 to 21, as many of the activities were found redundant. The team needed to reduce the number of activities, as the initial plan had a significant flaw in terms of time and cost management. The problem was that the initial project’s schedule was developed, taking into consideration that the team would be working seven days per week. However, the HR manager of Adwar Enterprises stated that it was against the law to insist that a person would work without holidays and insisted on a schedule base on a 40-hour week. Additionally, the payment for the project manager’s work would be too high, which would have caused the project to go over the budget. The actual WBS of the project is provided below:
Project Work Breakdown Structure
- Project Initiation
- Kick-off meeting
- Project Charter Development
- Budget Approval
- Project Planning
- Preparing project schedule
- Procurement plan development
- HR planning
- Quality assurance planning
- Risk assessment and contingency planning
- Project Implementation
- Receive procured materials
- Installing the wiring
- Installing the equipment
- Power supply management
- Initial testing and error fixing
- Secondary testing
- Employee Training
- Project Monitoring
- Quality Assurance
- Equipment monitoring
- Use monitoring
- Project closure
- Final report preparation
- Project handover to the client
- End project meeting
It should be noticed another significant failure of the project’s initial WBS. The list of activities did not include the employee training task, even though it was one of the three major deliverables. Thus, the project team was forced to add another task even though it was already pressed for time.
The changes in the WBS allowed the project manager to decrease the time required to complete the project. However, the project was still delivered seven days after the client’s deadline, regardless of minimising the number of activities and the time spent on these activities.
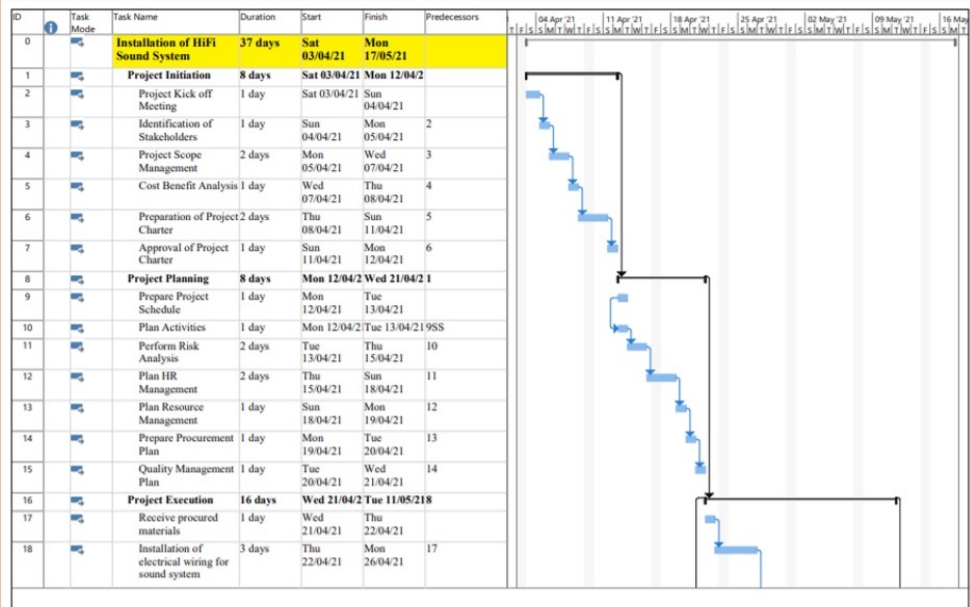
Time Constraint
Time management was one of the major failures of the project, as the project was not completed in time. Even though the initial schedule allowed seven days of slack, it was not enough to cover all the problems associated with time management. Moreover, the project team needed to make several adjustments in order to be able to complete the project in two months.
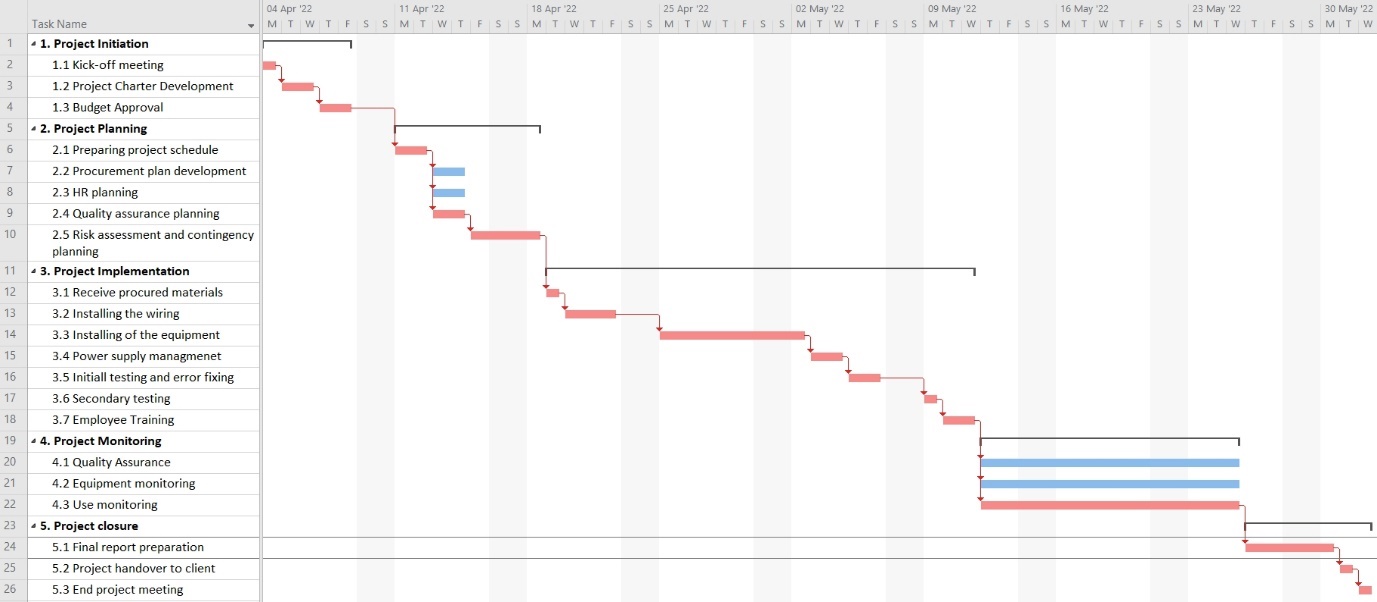
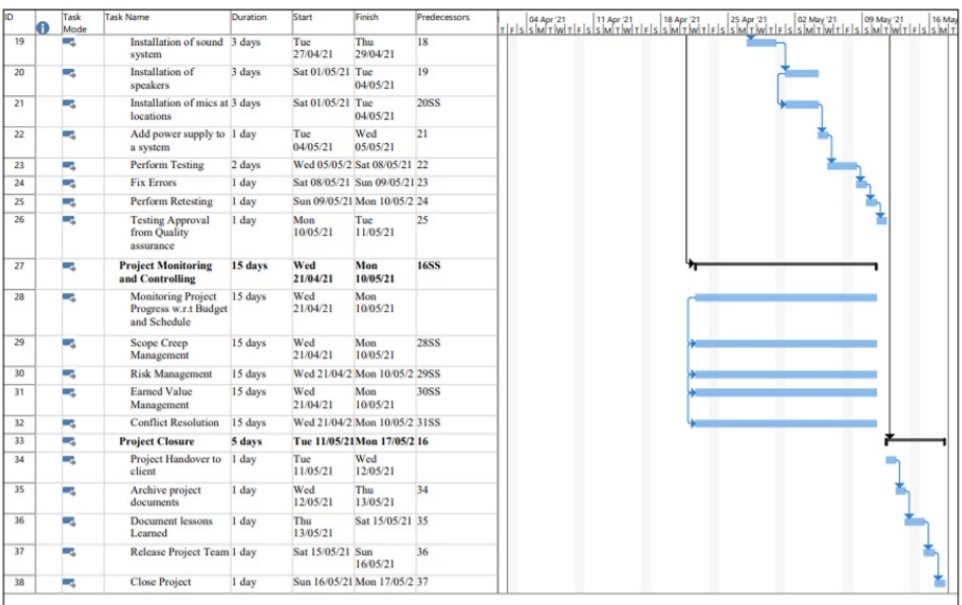
First, the project team reduced the first and the second stage from eight days to five and six days correspondingly. Such a decrease in the planned time was achieved by reducing the number of tasks and better task management. In particular, Tasks 2.2-2.4 were decided to do simultaneously by different team members to ensure time efficiency. Second, the number of days allocated to the fourth stage was shortened to 10 days. In reality, passive monitoring was conducted for 14 days, as workers were ready to fix any problems during the weekends as well. Thus, the monitoring stage was shortened from 15 days to 14 days. The actual schedule of the project can be seen in the Gantt chart provided in Figure 2 below.
Two primary reasons for the failure to complete the project in time were identified. The first reason was a failure to discuss the project plan with the financial and the HR managers, which led to incorrect assumptions before the project started. The second reason is the project manager’s insignificant experience. Dago (2018) stated that one of the common reasons for the failure of project time planning is the lack of experience of the project team. However, despite the significant failures in time management, the customer was still satisfied with the project outcomes due to effective stakeholder management, which will be discussed further in the report.
HR Management
Project Team
Another significant change in comparison with the original plan was made in the management of human resources. According to Adeola and Ganiyu (2020), adequate human resource management is one of the major success factors of a project. Without adequate human resource management, it is impossible to assure efficiency and effectiveness for project planning and implementation. Additionally, human resources are the major contributor to the project’s cost, which implies that it is closely connected to the budget constraint (Chemuturi, 2013).
Initially, the project team was planned to include seven members, including the project manager, the fulfilment director, a quality assurance manager, a financial manager, an HR manager, a risk manager, and a training manager. However, the final project team was reduced to four members to optimise the costs and improve the quality of provided services. The final project team included a project manager, a contractor manager, a financial manager, and a quality assurance manager.
It was initially planned for the electric wiring using the customer’s human resources since they already had a clear idea of the building’s communication systems and had all the necessary access. However, after careful consideration, it was decided to hire a contractor, which was the supplier of the equipment. According to Aamer (2018), outsourcing may be crucial for a project’s success, as it can reduce the cost of the project and help to focus on the primary activities.
Two reasons were identified for turning to outsourcing rather than using the human resources of Adwar Enterprises. First, the analysis revealed that using the services of a contractor was more time-effective, as the contractor’s team had a significant experience in the installation of the wiring and equipment, and no collaboration was required between the Adwar Properties’ team and the contractor team. Saving time was crucial for the project’s success due to the problems with initial assumptions described in the previous section. Second, the reduced time spent on the activity was also associated with decreased costs and financial risks, which was important for staying on budget.
Functional Organisation Structure
According to Ahmady, Mehrpour, and Nikooravesh (2016), functional organisational structure can be defined as “the framework of the relations on jobs, systems, operating process, people and groups making efforts to achieve the goals” (p. 456). In other words, the organisational structure is a method that can help to divide duties and responsibilities. Meredith and Mantel (2011) stated that the complexity of functional organisational structure is closely correlated with the scope of the project, as the larger the scope, the more complex the functional organisational structure. Since this installation of the sound system was a small-scale project, the functional organisational structure was fairly simple (see Figure 3 below).
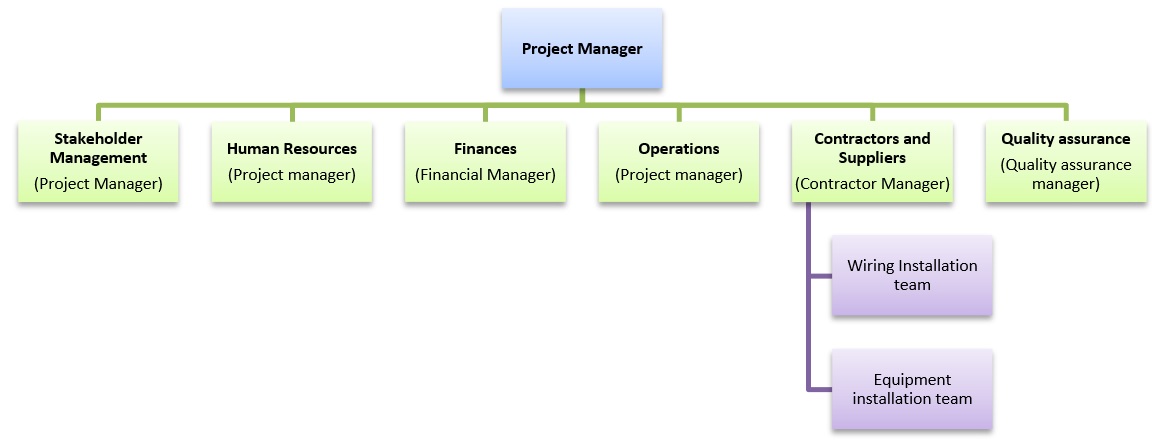
The functional organisation structure provided above demonstrates that the project manager had to carry out joined functions. Even though it was a significant concern for the project team, no issues were associated with improper functional organisational structure, as the project manager had enough experience to carry out several functions.
In summary, it may be concluded that human resource management was a significant contributor to the success of the project. Adequate adjustments in the number of project team members, along with the decision to hire contractors instead of using the team of Adwar Enterprises, helped to compensate for the project’s failure in terms of scope and time management.
Budget Constraint
The budget was another area of project management associated with significant issues. The initial budget was 150,000 QR even though the sponsor was allowed to spend 200,000 QR. The first and the second stages of the project were planned to cost 8,000 QR each, the third stage was planned to cost 112,000 QR, the fourth stage was planned to cost 15,000 QR, and the last stage was planned to cost 7,000 QR.
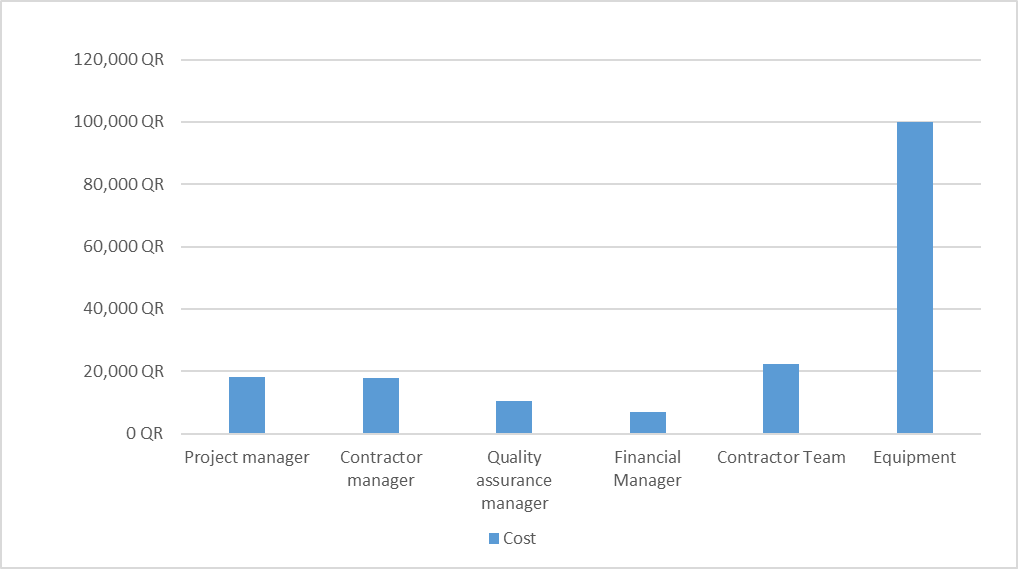
Initial cost planning was based on realistic assumptions. In particular, the planned cost of equipment (80,000 QR) was below the actual cost of all the equipment together with wiring and transportation, which was 100,000 QR. Additionally, the salaries of the project team were under-estimated. Such flaws in the budget planning would have led to going over the budget of the customer. However, since the number of tasks was decreased significantly, it was possible to stay on budget even after accounting for the increased cost of equipment and increased salaries for the project team. Table 1 below demonstrates a detailed budget analysis of the project.
Table 1. Budget analysis
The analysis provided above demonstrated that the actual cost of the project was 175,480 QR instead of the predicted 150,000 QR, which signifies a deviation of 17%. While the deviation was considerable, it was low enough to stay on the customer’s budget. Approximately 57% of the project’s cost was attributed to the cost of equipment, and around 13% was attributed to the cost of contractors. The rest of the cost was attributed to the project team (see Figure 4 for budget allocation).
In summary, even though the initial budget plan was a complete failure, the project team was able to make the necessary corrections to stay on budget by decreasing the number of tasks. The central reason for the failure was inadequate assumptions that led to incorrect calculations of the budget. The inadequacy of the assumptions was associated with poor market research. Thus, in future, it is recommended to conduct an in-depth analysis of the prices of the equipment and the wages of the project management team.
Stakeholder Management (Mendelow’s Matrix)
Stakeholder management was one of the strongest parts of the management of the project. Mendelow’s matrix, which is also called the stakeholder matrix, was the central approach used to plan stakeholder management. (Meredith and Mantel, 2011). According to this framework, all stakeholders can be distributed among four groups based on the level of their interest and power. Depending on the characteristics of the stakeholders, they can be managed closely, kept satisfied, kept informed, or be monitored. The initial stakeholder matrix is provided in Figure 5 below.
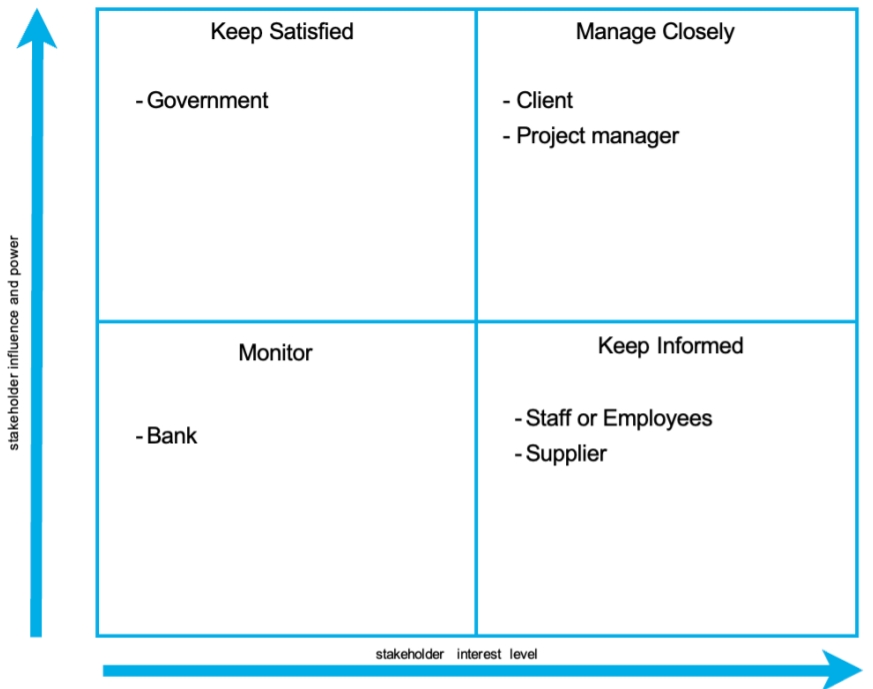
Only two small changes were made to the initial stakeholder matrix. A detailed discussion of the stakeholder matrix is provided below.
High Power – High Interest
Initially, this group included the client and the project manager; however, it was decided to include the entire project team in this category. The stakeholders in this group were managed closely, as it is recommended by Meredith and Mantel (2011). In particular, the team members always discussed any concerns they had about the project implementation and communication to ensure the team’s satisfaction.
As for the customer, any changes in the original plan were immediately discussed with the customer’s representative through messengers or phone calls, and formal reports were sent to the customer to ensure awareness and satisfaction. Such a personal and caring approach allowed to mitigate numerous problems associated with the project implementation. In particular, since the customer was informed about all the changes and their consequences and new deadlines were renegotiated, customer satisfaction remained high. The key point in managing the customer was the explanation that the equipment was available for use starting on May 12, when the monitoring phase of the project began. This was enough for the customer to be satisfied, as the company needed the equipment for the big conference on May 25.
High Power – Low Interest
This category of stakeholders included federal and local governments, which were kept satisfied, as recommended by Meredith and Mantel (2011). The primary concern of the government was to keep all the documentation intact and all the taxes paid. It was ensured by all members of the project team.
Low Power – High Interest
This section included the contractors and their employees, as they were interested in giving their best to the project and had little power to affect its flow. These stakeholders were kept informed about all the changes in the schedule and concerns of the customer to ensure that the contractors could adjust their operations to meet the needs of the project.
Low Power – Low Interest
Initially, this category included the bank; however, it was later decided that the bank was not a significant stakeholder to be managed. Thus, it was not monitored as it was initially planned.
Implications
Stakeholder management strategy was one of the primary drivers of the project’s success. Careful stakeholder management helped to mitigate several risks, including the risks of increased cost, delays in delivery, and decreased customer satisfaction. Minimal changes were made to the original stakeholder management plan, which implied that the initial plan was adequate.
Communications Management
The communications management plan was another strong side of the initial project plan. No significant changes were made to the initial communication plan, which is provided in Figure 6 below.
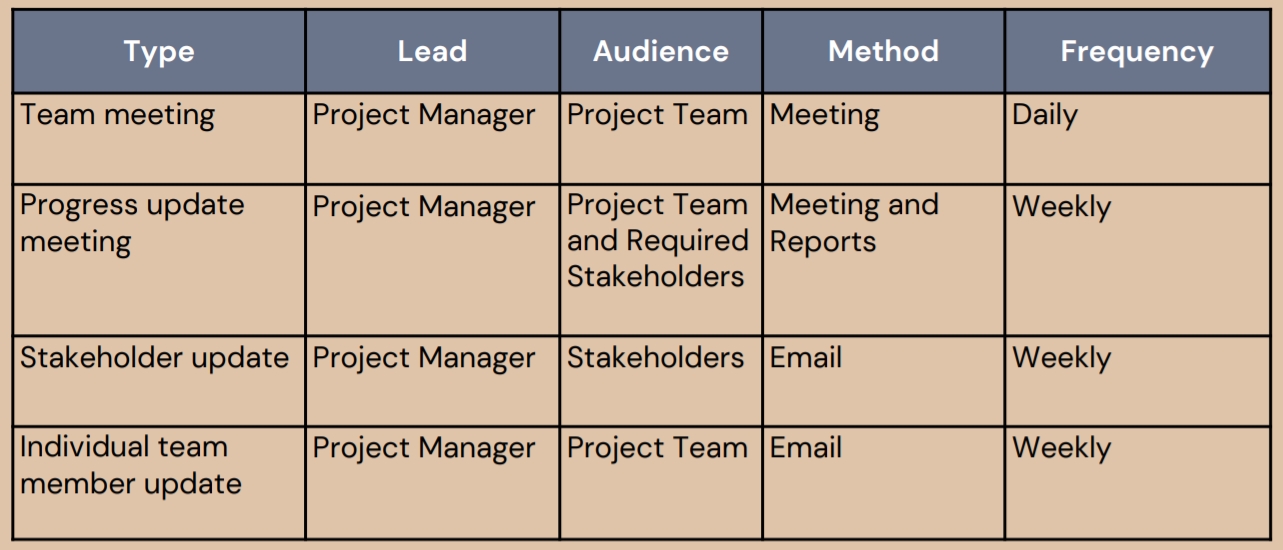
The communication plan played a crucial role in the project’s success. In particular, the communication plan allowed complete transparency of the project flow, allowed to attend to any of the concerns of stakeholders and set the expectations for all the tasks. The daily team meetings, even though they were relatively short, allowed the project team to bond and act as together to achieve a common goal. Progress update meetings were conducted only twice with the customer to report on the delays and the initiation of the fourth phase of the project, which meant that the equipment was ready for use. Email updates were sent automatically by the project management software, which allowed to stay timely on the project updates.
The only thing that was added to the communication plan was on-demand phone calls and messages among the team members and the customer to allow quick reaction to any changes or emergencies.
Risk Management
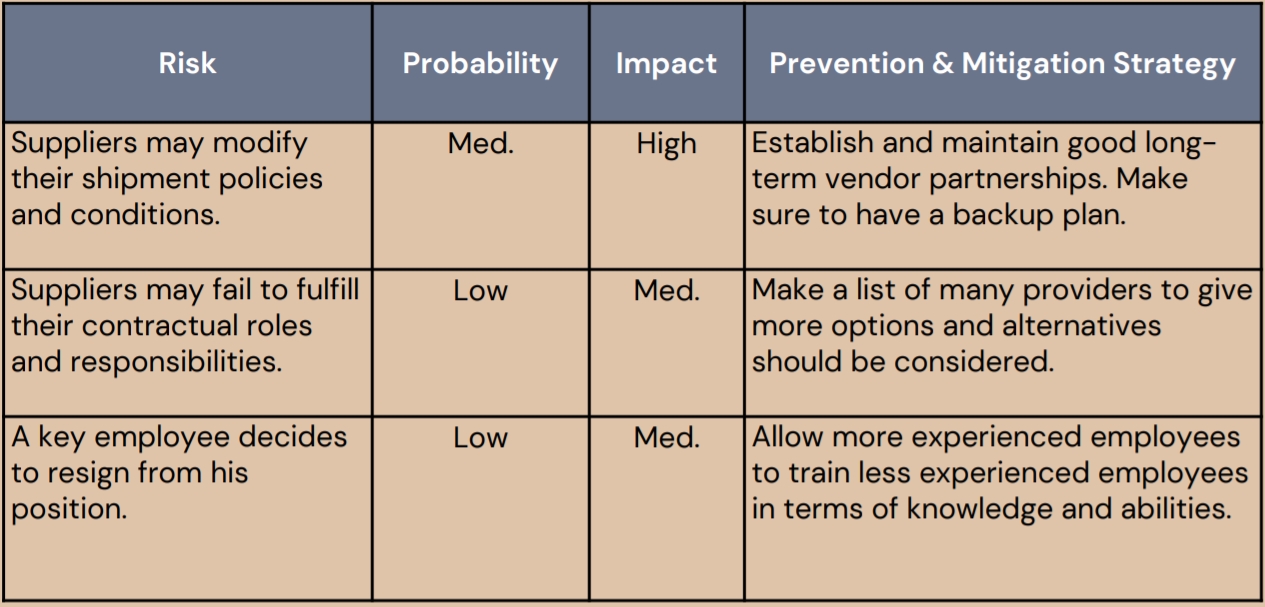
The initial risk management plan was inadequate, as it failed to attend to many risks that were revealed during the implementation of the project. The initial risk management plan is provided in Appendix B. Significant modifications were made to the preliminary risk management plan during the second week of project implementation, after the procurement, HR, and quality assurance plans were ready. The modified version of the risk management plan is provided in Table 2 below.
Table 2. Risk management plan
Quality Management
Quality assurance was one of the strongest parts of the project that allowed to ensure customer satisfaction with the project results. It was initially planned to spend two weeks on the monitoring phase, which was essentially the quality assurance phase. The project team wanted to reduce the number of days spent on the quality assurance phase to be able to hand over the project faster. However, the quality assurance manager insisted that full two weeks were allowed to spend on testing and fixing. As it turned out, the time spent on quality assurance was essential, as several crucial problems were identified and fixed during the stage. The quality management procedures included ongoing monitoring of the quality of the equipment and providing services along with stress testing of the equipment after the installation.
Conclusion and Recommendations
Despite several failures, the project is to be considered a success due to three central factors. First, all the planned activities were accomplished, which implies that the scope of the project was managed appropriately. Second, the project was below the budget cap of 200,000 QR, which implies that the financial management was adequate. Finally, the customer was fully satisfied with the provided services. The central flaw of the project was the inability to finish the project within the required timeframe. However, careful stakeholder management and effective communication with the customer allowed to mitigate the problem.
Several lessons were learned from the implementation, which is provided below as a list of recommendations for projects of similar scope in the future.
- Consult HR and legal specialists before introducing the project plan to the customer. The original plan was inadequate due to the project manager’s failure to comply with the HR and legal policies of the customer. This could have been avoided if an HR manager and a legal specialist of Adwar Enterprises had been consulted.
- Review the project plan for redundant tasks. The initial project plan can numerous redundant tasks that would have increased the cost and the length of the project in time. A careful review of the scope of the project allowed to minimise the number of tasks, which allowed to save time and money.
- Optimise the number of parallel tasks. Project implementation demonstrated that the project could be optimised by increasing the number of tasks that can be completed simultaneously. However, the project manager needs to ensure that there are enough resources to cover all the tasks.
- Ensure that all the team members are essential and that all the essential team members are available. The initial team included several team members that would have increased the cost of the project without affecting its scope and timeframe. Thus, it was decided to decrease the number of team members to decrease the cost of the project. At the same time, all the essential stakeholders were present.
- Outsource what can be outsourced. This project demonstrated that outsourcing positively affected the quality of the provided services decreased the time of implementation, and reduced the cost of implementation.
- Conduct in-depth research of the suppliers/contractors. The implementation of the project demonstrated that the initial cost of the project could be increased if the project manager planned the cost of equipment and provided services inadequately.
- Manage stakeholders carefully. Careful management of stakeholders was the key to mitigating risks associated with delays in the project’s implementation.
- Align the stakeholder management plan with the communications plan. Such an endeavour allowed the team to meet the needs of all the stakeholders.
- Allow team members to create their own risk management plan. Instead of having a designated risk manager, it appeared more efficient to let each team member create a risk management plan and then consolidate these plans into one. Team members are usually highly qualified in their narrow specialisation, which allows them to make adequate and relevant risk management plans.
- Allow enough time for quality assurance. Quality assurance turned out to be a crucial step in the implementation process that allowed to ensure customer satisfaction. The period of quality assurance should not be decreased.
References
Aamer, A. M. (2018) ‘Outsourcing in non-developed supplier markets: a lean thinking approach’, International Journal of Production Research, 56(18), pp. 6048-6065.
Adeola, O. S. and Ganiyu, A. R. (2020) ‘A Fuzzy System for Evaluating Human Resources in Project Management, International Journal of Technology Diffusion (IJTD), 11(1), pp. 66-95.
Adwar Enterprises (2017) Who we are.
Ahmady, G. A., Mehrpour, M. and Nikooravesh, A. (2016) ‘Organisational structure’, Procedia-Social and Behavioral Sciences, 230, pp. 455-462.
Burghate, M. (2018) ‘Work breakdown structure: Simplifying project management, International Journal of Commerce and Management, 3(2), pp. 453-461.
Chemuturi, M. (2013) Mastering IT Project Management: Best Practices, Tools, and Techniques. United States: J. Ross Publishing.
Dago, T. (2018). Reasons for Success and Failure of Projects [Thesis].
Martinelli, R. J. and Milosevic, D. Z. (2016) Project Management ToolBox: Tools and Techniques for the Practicing Project Manager. United Kingdom: Wiley.
Meredith, J. R. and Mantel S. J. (2011) Project management: a managerial approach, 8th ed, Wiley.
Appendix A
Appendix B