Introduction
Resource management is crucial for any company to ensure adequate financial performance and competitive advantage. According to the resource-based view (RBV), resources are the key to the superior performance of firms, as effective resource use is associated with the firm’s ability to gain a competitive advantage (Clark and Barney, 2007). RBV differentiates between tangible and intangible resources, which must be valuable, rare, inimitable, and organised in order to have the possibility to sustain this advantage (Clark and Barney, 2007). Essentially, RBV describes financial (tangible) and human (intangible) resources and their effect on organisational performance.
The present focuses on the case study of resource management of two companies competing in the supermarket industry, including Morrisons and Sainsbury’s. The purpose of the paper was to demonstrate the importance of the integration of human and financial resources to gain a sustained competitive advantage. The paper is divided into three essential parts. The first part provides brief company descriptions and trends in the industry to set a background for the case study. The second part focuses on human resource management in the companies using techniques and theories concerning human capital development and organisational change theories. The third part focuses on the evaluation of financial resource management using financial ratios. The paper is concluded with a set of recommendations based on the comparative analysis. The report is supplemented with an Excel spreadsheet that provides detailed calculations of financial ratios.
Background
Wm Morrison Supermarkets Limited
Wm Morrison Supermarket Limited operates under the brand name of Morrisons, retailing food, clothing, general merchandise products, fuel and services across the UK. The company employs more than 10,000 employees that work in 497 conveniently located stores (Wm Morrison Supermarkets Limited, 2022). The company has experienced steady growth in revenues for the past five years due to the growing number of stores. The company identified seven priorities, which are being more competitive, serving the customers better, integrating with the local community, speeding up the organisation, promoting digitalisation, taking pride and hygiene, and scaling for profitable growth (Wm Morrison Supermarkets Limited, 2022). According to Statista (2022), the company’s market share in the supermarket industry was 9.5% in April 2022. Thus, the company is the fourth-largest company in the industry.
J Sainsbury PLC
J Sainsbury PLC is the second-largest supermarket and convenience store chain in the UK, marketing under the names of Sainsbury’s supermarkets, Argos, Habitat, Tu, and Nectar (J Sainsbury PLC, 2022). The company has more than 600 supermarkets and over 800 convenience stores operated by 189,000 employees (J Sainsbury PLC, 2022). Currently, the company focuses on the development of online channels of sales to increase convenience for the customers. According to Statista (2022), Sainsbury has the largest market share of 15%, second only to Tresco, which has a market share of 27.3%. Thus, Sainsbury’s supermarkets are comparable to Morrisons in terms of size and approach to business.
Human Resource Management Assessment
Human Capital Development
The idea of human capital development is associated with the human capital theory, which was developed in the mid-1900s by economists Gary Becker and Theodore Schultz (Nafukho, Hairston, and Brooks, 2004). The theory sees human capital as an intangible resource of the employees’ skills and knowledge (Calkin, 2018). The theory assumes that a human can improve its performance at work by receiving better education and training (Calkin, 2018). Thus, companies can increase human capital by investing in employee training and education.
Wm Morrisons appears to acknowledge the importance of human capital and made increased investments in the area of employee development in 2021. First, the company established a new corporate culture based on listening to the employees, understanding their needs, and responding to them (Wm Morrison Supermarkets Limited, 2022). The pandemic had a significant impact on the company’s corporate culture due to limitations associated with the COVID-19 preventive measures, and new corporate culture needed to be established. Second, the company invested in the organisation of courses to help the employees move to remote work (Wm Morrison Supermarkets Limited, 2022). This increased the efficiency of employees and contributed to the company’s adaptation to operating during the pandemic. Finally, the company invested in teamwork training to boost trusting communication among managers (Wm Morrison Supermarkets Limited, 2022). This allowed a better knowledge transfer among employees, which could boost the company’s performance.
Sainsbury’s also acknowledges the importance of investing in human capital. In 2021, the company continued to invest in personnel despite poor profitability (J Sainsbury PLC, 2022). The company focused on talent development through a training program for future leaders, which is a different route in comparison with Morrisons supermarkets, which focused on developing the everyday skills of the employees. Additionally, Sainsbury’s put increased emphasis on safety training due to the pandemic and training concerning the prevention of modern-day slavery (J Sainsbury PLC, 2022). Thus, both companies developed their human capital, which increased their intangible resources.
Change Theory Integration
There are numerous organisational change theories that describe the process of change. In 2021, both companies faced the need for change in operations and workplace culture to adapt to the COVID-19 pandemic. Lewin’s force field model is the most appropriate framework for describing the changes in the companies. Lewin’s Force Field Analysis is a commonly used decision-making model used by change managers. According to the model, the current status Quo can be explained by equilibrium in two types of forces, restraining and driving (Swanson and Creed, 2014). Driving forces are usually positive, reasonable, logical, conscious, and economical while restraining forces are negative, emotional, illogical, unconscious, social, and psychological (Kruglanski et al., 2012). If the driving forces are stronger than the restraining forces, a change will happen. Therefore, managers need to understand both the driving and the restraining forces to manage change.
Morrisons clearly acknowledged the need for change and employees as the central restraining force. As a result, the company invested in the transformation of the workplace culture to ensure the effectiveness of HR management. As a result, the company was able to sustain its financial performance under the pressure of unfavourable external factors. At the same time, Sainsbury’s failed to invest in culture change, which led to the poor financial performance of the company. The financial performance of both companies is discussed in the next chapter.
Financial Resource Management Assessment
The analysis of financial resource use is crucial for understanding how well the company uses its tangible assets to sustain its competitive advantage. Ratio analysis is one of the most frequently used methods for assessing the financial health of a company (McLaney, 2009). Ratio analysis may also be beneficial for predicting stock prices and trends (Arkan, 2016). The section focuses on the discussion of four types of financial ratios and investment appraisal. Detailed calculations are provided in the supplementary Excel file.
Profitability Ratios
Profitability is usually measured by four different ratios, including gross profit margin (GPM), net profit margin (NPM), return on capital employed (ROCE), and mark-up (Elliott and Elliott, 2015). The gross profit margin gives the company ability to control the cost of goods sold (COGS) in realising the company objectives (Gowthorpe, 2021). It is calculated by dividing the gross profit by net sales (Gowthorpe, 2021). NPM demonstrates how well a company performs in terms of controlling all the costs. NPM is calculated by dividing net profit by total revenues (Elliott and Elliott, 2015). ROCE provides the percentage return of every dollar invested in the organisation (Gowthorpe, 2021). It is calculated by dividing earnings before interest and taxes (EBIT) by capital employed (Gowthorpe, 2021). Finally, the mark-up gives the profit percentage compared to the cost of a good (Elliott and Elliott, 2015). It is calculated by dividing net profit by COGS. The results of the profitability analysis are provided in Tables 1 and 2 below.
Table 1. Profitability of Morrisons
Table 2. Profitability of Sainsbury’s
The analysis of the five-year trend revealed that Morrisons outperformed Sainsbury’s in all of the profitability ratios except for the gross profit margin. This implies that Sainsbury’s controlled the costs of goods better than Morrisons. However, since the NPM of Morrisons supermarkets was better between 2017 and 2021 in comparison with that of Sainsbury’s, it may be concluded that Morrisons was able to control its costs better than Sainsbury’s. However, Morrisons can improve its current profitability even further by implementing rigorous control over COGS, similar to Sainsbury’s.
When compared to industry averages taken from Ready Ratios (2022), the profitability of both Morrisons and Sainsbury’s was below average compared to the grocery retail companies in the US. However, such a measure may be inappropriate since the industry averages in the UK may be different. Unfortunately, the benchmarking values of the UK are unavailable for public use. The benchmarking values for US are provided in Table 3 below.
Table 3. US grocery stores’ profitability ratio benchmarks (Ready Ratios, 2022)
Liquidity Ratios
Liquidity ratios help the stakeholders understand if the company has enough current assets to cover its current expenses without using additional funds. Liquidity ratios include the current ratio and quick ratio (Elliott and Elliott, 2015). Current ratio was calculated by dividing the current assets by current liabilities. Quick ratio was calculated by subtracting inventories from current assets and then dividing the result by current liabilities. The quick ratio is similar to the current ratio; however, it does not take into consideration the inventories, as they may be difficult to turn into cash (Gowthorpe, 2021). Cash ratio was used to determine the proportion of cash in the current assets, as cash is the most liquid asset (McLaney, 2009). The cash ratio was calculated by dividing cash and equivalents by current assets. The trends in the ratios for the past five years are provided in Tables 4-5 below.
Table 4. Liquidity ratios for Morrisons
Table 5. Liquidity ratios for Sainsbury’s
The analysis demonstrated that Sainsbury’s outperformed Morrisons supermarkets in terms of liquidity based on the current ratio and quick ratio is 2021 and historically. However, both companies underperformed when compared to the industry average of 1.12 and 0.61 for current and quick ratios, correspondingly (Ready Ratios, 2022). Additionally, the current ratios of both companies were below 1, which implied that both companies did not have enough current assets to cover their short-term debt. According to Elliot and Elliot (2015), the current ratio below may appear alarming for investors; however, sometimes, the current ratio is below 1 in solid companies. Morrison is recommended to improve its liquidity to ensure the support of the investors and creditors.
Efficiency Ratios
The companies’ efficiency was measured using the inventory turnover ratio and asset turnover ratio. The inventory turnover ratio demonstrates how efficiently the company could sell its inventories. It essentially demonstrates how many times the company could sell its inventories during the year. Asset turnover ratio demonstrates how efficiently the company uses its assets to generate sales (Elliot and Elliot, 2015). The efficiency ratios of both firms are visualised in Figure 1 below.
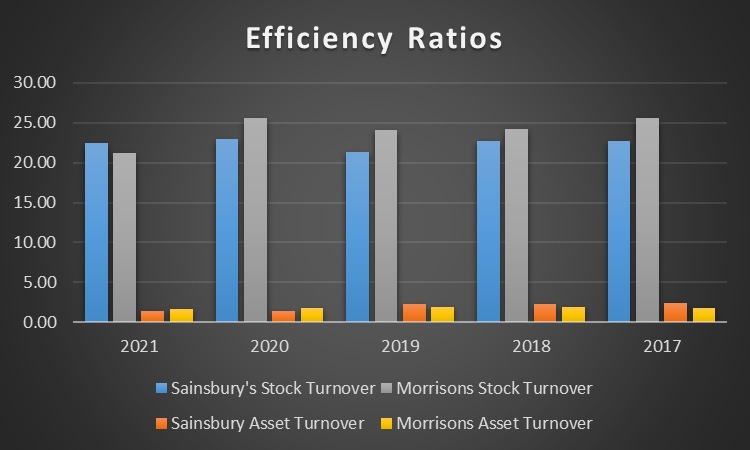
The analysis demonstrated that Sainsbury demonstrated a stable performance in terms of inventory turnover for the past five years. However, historically, Morrisons outperformed Sainsbury’s in terms of stock turnover between 2017 and 2020, even though the performance was volatile. At the same time, both companies performed above the industry’s average inventory turnover ratio of 16 (Ready Ratios, 2022). As for asset turnover ratios, Sainsbury’s experienced a significant decline in asset turnover ratio, which was explained by a significant increase in non-current assets in 2020. As for Morrisons, its asset turnover was relatively stable between 2017 and 2021. Even though Morrisons outperformed Sainsbury’s in asset turnover in 2022, both companies performed the industry average of 2.28 (Ready Ratios, 2022). Thus, Sainsbury is recommended to look for ways to improve its asset management practices to use its new-acquired assets more efficiently.
Financial Gearing Ratios
Financial gearing was measured using debt ratio, debt to equity ratio, and interest coverage ratio. Both debt-to-equity and debt ratios demonstrate the proportion of liabilities the company uses to finance its assets. Debt ratio was calculated by dividing total liabilities by total assets, and debt-to-equity ratio was calculated by dividing total liabilities by total shareholder equity. The interest coverage ratio demonstrates the company’s ability to pay off interest. The results of calculations are provided in Tables 6-7.
Table 6. Morrisons financial gearing
Table 7. Sainsbury’s financial gearing
The analysis revealed that Sainsbury’s was using debt to finance its assets more aggressively than Morrisons in 2020 and 2021, as a result of losses associated with the COVID-19 pandemic. As a result, the company was unable to pay off interest in 2020 and 2021. Even though Morrisons’ ability to pay off interest decreased in 2021, the firm was still able to cover interest 2.5 times, while Sainsbury’s interest cover ratio was only 0.81. However, both companies underperformed in comparison with the industry average of 15 (Ready Ratios, 2022). Sainsbury’s performance in terms of financial gearing is a sign of extreme concern that should be addressed in the nearest future to ensure the trust of creditors.
Investment Appraisal
Invest appraisal was conducted using investment ratios, including earnings per share (EPS) and price-to-earnings (P/E) ratio. The ratios were calculated for both companies using year-end prices per share taken from investing.com and the diluted number of ordinary shares presented in the annual reports of both companies for the years 2017-2022. The results of calculations are provided in Tables 8-9 below.
Table 8. Investment appraisal of Morrisons
Table 9. Investment appraisal of Sainsbury’s
The EPS ratio demonstrates how much of net income is attributed to each share (McLaney, 2009). According to this criterion, Morrisons demonstrated a better performance during the past five years. In fact, Wm Morrisons’ EPS increased between 2017 and 2020 from £129.51 to £144.47; however, industry trends that affected both Morrisons and Sainsbury’s affected the profitability of both companies negatively, which decreased both companies’ EPS ratios. While Morrisons managed to sustain positive profitability, Sainsbury’s net income was negative in 2021, which made the company’s EPS negative as well. Thus, from the point of view of the EPS ratio, Morrisons is a more attractive investment.
The P/E ratio is a crucial investment ratio that helps to compare two companies using the “apples-to-apples” comparison. The ratio demonstrates how the current share price is compared to EPS, which helps to identify if the stock is overvalued or undervalued. The results of the calculations revealed that Sainsbury’s underperformed in comparison with Morrisons in terms of the P/E ratio between 2017 and 2021. The prices per share of both companies increased in 2021 due to industry trends, while the EPS ratios decreased. Thus, even though Morrisons outperformed Sainsbury in terms of the P/E ratio, both stocks are extremely overvalued, which may mean that the share prices will decrease long-term.
Conclusion
The comparative analysis of Wm Morrisons Supermarkets Limiter and J Sainsbury PLC using RBV, human capital theory, Lewin’s force field model, and financial ratio analysis revealed provided valuable insights into the performance of two companies. First, the analysis revealed that both companies acknowledged the importance of human capital and invested in the development of their employees. Second, Lewin’s force field analysis revealed that Sainsbury’s failed to address resistance to change in operations and corporate culture, which led to poor financial performance. Third, financial ratio analysis revealed that Morrisons outperformed Sainsbury’s in terms of profitability, efficiency, and leverage during the past five years, while Sainsbury’s had a better performance in terms of liquidity. Finally, the analysis demonstrated that Morrisons is a more attractive investment than Sainsbury’s based on EPS and P/E ratios.
Reference List
Arkan, T. (2016) ‘The importance of financial ratios in predicting stock price trends: A case study in emerging markets, Finance, Rynki Finansowe, Ubezpieczenia, 79, pp. 13-26.
Calkin, S. (2018). Human Capital in Gender and Development. United Kingdom: Taylor & Francis.
Clark, D. N. and Barney, J. B. (2007) Resource-Based Theory: Creating and Sustaining Competitive Advantage. United Kingdom: OUP Oxford.
Elliott, B. and Elliott, J. (2015) Financial accounting and reporting. New York: Pearson.
Gowthorpe, C. (2021) Business accounting and finance. Boston: Cengage Learning.
J Sainsbury PLC (2022) Annual report 2021. Web.
Kruglanski, A. W. et al. (2012) ‘The energetics of motivated cognition: a force-field analysis’. Psychological Review, 119(1), pp. 1-20.
McLaney, E. J. (2009) Business finance: Theory and practice. New Jersey: Prentice-Hall/Financial Times.
Nafukho, F. M., Hairston, N., and Brooks, K. (2004) ‘Human capital theory: Implications for human resource development, Human Resource Development International, 7(4), pp. 545-551.
Ready Ratios (2022) Grocery Stores: Average industry financial ratios for U.S. listed companies. Web.
Statista (2022) Market share of grocery stores in Great Britain from January 2017 to April 2022. Web.
Swanson, D. J. and Creed, A. S. (2014) ‘Sharpening the focus of force field analysis, Journal of Change Management, 14(1), pp. 28-47.
Wm Morrison Supermarkets Limited (2022) Annual report 2022. Web.